Nintendo 2007 Annual Report Download
Download and view the complete annual report
Please find the complete 2007 Nintendo annual report below. You can navigate through the pages in the report by either clicking on the pages listed below, or by using the keyword search tool below to find specific information within the annual report.-
 1
1 -
 2
2 -
 3
3 -
 4
4 -
 5
5 -
 6
6 -
 7
7 -
 8
8 -
 9
9 -
 10
10 -
 11
11 -
 12
12 -
13
-
14
-
15
-
16
-
17
-
18
-
19
-
20
-
21
 |
 |

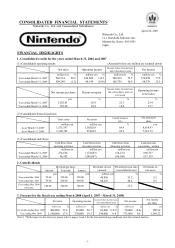
CONSOLIDATED FINANCIAL STATEMENTS
N
intendo Co., Ltd. and Consolidated Subsidiaries
April 26, 2007
N
intendo Co., Ltd.
11-1 Kamitoba hokotate-cho
,
Minami-ku, Kyoto 601-8501
Japan
FINANCIAL HIGHLIGHTS
1. Consolidated results for the years ended March 31, 2006 and 2007
(1) Consolidated operating results (Amounts below one million are rounded down)
Net sales Operating income Income before income taxes
and extraordinary items Net income
million yen % million yen % million yen % million yen %
Year ended March 31, 2007
Year ended March 31, 2006
Net income per share Return on equity
yen % % %
Year ended March 31, 2007
Year ended March 31, 2006
(2) Consolidated financial position
Total assets Net assets Capital adequacy
ratio
Net assets pe
r
share
million yen million yen % yen
As of March 31, 2007
As of March 31, 2006
(3) Consolidated cash flows
Cash and cas
h
e
q
uivalents - endin
g
million yen million yen million yen million yen
Year ended March 31, 2007
Year ended March 31, 2006
2. Cash dividends
Dividend per share
Interim Year-end Annual
yen yen yen million yen % %
Year ended Mar. 2006
Year ended Mar. 2007
Year ending Mar. 2008
(forecast)
3. Forecast for the fiscal year ending March 2008 (April 1, 2007 - March 31, 2008)
million yen %million yen %million yen %million yen %yen
Six months ending Sept. 2007
Year ending Mar. 2008
[Notes] *With respect to this forecast, please refer to pages 3 and 4 for the forward-looking conditions and other related matters.
Dividends in total
(annual)
Dividend payout ratio
(consolidated basis)
Dividends on
net assets
Net sales Operating income Income before income taxes
and extraordinary items Net income Net income
per share
140.00
70.00
(208,807) 617,139
1,575,597 8,614.97
1,160,703
Cash flows fro
m
investing activities
Cash flows fro
m
financing activities
46,382 (60,166)
274,634
1,102,018 69.9
974,091
688,737 (50,137)
7,613.79 83.9
(174,603)
Cash flows fro
m
operating activities
89.8 966,534
509,249 (1.2)
1,362.61
762.28
150.2
226,024
90,349 (19.0)
79.7 288,839
160,759 10.6
77.2 174,290
98,378 12.5
Operating income
to net sales
Income before income taxes
and extraordinary items on
total assets
16.8
10.4
21.1
14.0
23.4
17.7
390.92
1,140,000 270,000 290,000 175,000 1,368.22
53.9 26.7 460,000 85,000 (8.0)
17.9 19.5 0.4 0.4
85,000 50,000
(10.2)
70.00 320.00
620.00
560.00
390.00
690.00
700.00
88,253
49,886 51.2
50.6
51.2
5.3
8.5
- 1 -
Table of contents
-
Page 1
...Net income per share yen Year ended March 31, 2007 Year ended March 31, 2006 Return on equity % Income before income taxes and extraordinary items on total assets Operating income to net sales % % 1,362.61 762.28 16.8 10.4 21.1 14.0 23.4 17.7 (2) Consolidated financial position Total assets... -
Page 2
... the fiscal year ended March 31, 2007 Addition: Nintendo of Korea Co., Ltd. [Note] Please refer to "Company Group Information" at page 5 for details. (2) Changes on the basis of consolidated financial statements preparation Related to accounting standard revisions etc. Applicable Other changes... -
Page 3
... a new growth path with strong performance in both "Nintendo DS" and "Wii". In Japan, the overall game market is expanding. Consolidated net sales for the fiscal year ended March 31, 2007 resulted in 966.5 billion yen, including overseas sales of 643.0 billion yen, which accounted for 66.5% of total... -
Page 4
...to internally provide the capital necessary to fund future growth, including capital investments, and to maintain a strong and liquid financial position in preparation for changes in the business environment and intensified competition. As for direct profit returns to our shareholders, dividends are... -
Page 5
... concurred by share Financial Business The Company's The Company's (%) support relationship directors employees 100 1 5 †Purchasing the Company's products Company's name Address Capital Major business Distribution of electronic entertainment products Leased facilities Nintendo of Korea Co... -
Page 6
Nintendo Co., Ltd. CONSOLIDATED BALANCE SHEETS Date Description As of March 31, 2006 Amount million yen % As of March 31, 2007 Amount million yen % Increase (decrease) Amount million yen (Assets) Current assets 1 Cash and deposits 2 Notes and trade accounts receivable 3 Securities 4... -
Page 7
Nintendo Co., Ltd. Date Description As of March 31, 2006 Amount million yen % As of March 31, 2007 Amount million yen % Increase (decrease) Amount million yen (Liabilities) Current liabilities 1 Notes and trade accounts payable 2 Accrued income taxes 3 Reserve for bonuses 4 Other ... -
Page 8
Nintendo Co., Ltd. CONSOLIDATED STATEMENTS OF INCOME Period Year ended March 31, 2006 Amount million yen ï¼... ï¼... 100.0 Year ended March 31, 2007 Amount million yen ï¼... ï¼... 100.0 Increase (decrease) A million yen ï¼... De c i i Net sales Cost of sales Gross margin Selling, general, ... -
Page 9
...1 Gains on disposal of treasury stock 11,584 0 0 11,585 Additional paid-in capital - Ending (Retained earnings) Retained earnings - Beginning Increase 1 Net income 1,032,834 98,378 98,378 35,139 34,969 170 1,096,073 Decrease 1 Cash dividends 2 Directors' bonuses Retained earnings - Ending -9- -
Page 10
...Appendix> Nintendo Co., Ltd. CONSOLIDATED STATEMENT OF NET ASSETS Year ended March 31, 2007 (April 1, 2006 - March 31, 2007) million yen Owners' equity Common stock Balance as of March 31, 2006 Amount of changes in the fiscal year * Dividends from retained earnings Dividends from retained earnings... -
Page 11
... Co., Ltd. CONSOLIDATED STATEMENTS OF CASH FLOWS Period Description Year Ended March 31, 2006 Amount million yen Year Ended March 31, 2007 Amount million yen Cash flows from operating activities: Income before income taxes and minority interests Depreciation and amortization Increase (decrease) in... -
Page 12
... BASIS OF CONSOLIDATED FINANCIAL STATEMENTS PREPARATION 1. Scope of Consolidation Nintendo of Korea Co., Ltd. is newly consolidated as of the consolidated accounting period ended March 31, 2007 due to capital investments. (Changes in accounting policies) (Accounting standard for directors' bonuses... -
Page 13
... information is not applicable to Nintendo's business. 2. Segment Information by Seller's Location Year ended March 31, 2006 Japan Net sales (1) Sales to third parties (2) Inter-segment sales Total Operating expenses Operating income A e Year ended March 31, 2007 Japan Net sales (1) Sales to third... -
Page 14
...Nintendo Co., Ltd. NON-CONSOLIDATED BALANCE SHEETS Date Description As of March 31, 2006 Amount million yen % As of March 31, 2007 Amount million yen % Increase (decrease) Amount million yen (Assets) Current assets 1 Cash and deposits 2 Notes receivable 3 Trade accounts receivable 4 Securities... -
Page 15
... Total additional paid-in capital Retained earnings 1 Legal reserve 2 Optional reserve (1) Special reserve (2) General reserve 3 Unappropriated Total retained earnings Unrealized gains on other securities Treasury stock, at cost Total shareholders' equity Total liablities and shareholders' equity... -
Page 16
...> Nintendo Co., Ltd. Date As of March 31, 2006 Amount million yen % As of March 31, 2007 Amount million yen % Increase (decrease) Amount million yen Description (Net assets) Owners' equity 1 Common stock 2 Additional paid-in capital (1) Capital reserve (2) Other additional paid-in capital... -
Page 17
...> Nintendo Co., Ltd. NON-CONSOLIDATED STATEMENTS OF INCOME Period Description Year Ended March 31, 2006 Amount million yen % Year Ended March 31, 2007 Amount million yen % Increase (decrease) Amount million yen % Net sales Cost of sales Gross margin Selling, general, and administrative expenses... -
Page 18
...NON-CONSOLIDATED APPROPRIATION STATEMENT Approved on June 29, 2006 at the Annual General Meeting of Shareholders Amount million yen Unappropriated retained earnings Reversal of special reserve 1 Transfer from reserve for deferred fixed assets Total Allocation 1 2 3 Cash dividends Directors' bonuses... -
Page 19
Nintendo Co., Ltd. NON-CONSOLIDATED STATEMENT OF NET ASSETS Year ended March 2007 (April 1, 2006 - March 31, 2007) million yen Owners' equity Additional paid-in capital Other additional Capital reserve paid-in capital 0 11,584 Common stock Balance as of March 31, 2006 Amount of changes... -
Page 20
...March 31, 2006 Capital investments Depreciation expenses of tangible assets Research and development expenses Marketing expenses Foreign exchange gains Foreign exchange losses Number of employees (At year-end) Average exchange rates 1 US $ = 1 Euro = 5,597 3,442 30,596 55,442 45,515 3,150 113.31 yen... -
Page 21
... (4) Consolidated sales units, number of new titles, and sales unit forecast Nintendo Co., Ltd. Sales Units in Ten Thousands Number of New Titles Released Hardware Japan The Americas Other Total of which Game Boy Advance SP Japan The Americas Other Total of which Game Boy Micro Japan The Americas...