3M 2007 Annual Report Download - page 6
Download and view the complete annual report
Please find page 6 of the 2007 3M annual report below. You can navigate through the pages in the report by either clicking on the pages listed below, or by using the keyword search tool below to find specific information within the annual report.-
 1
1 -
 2
2 -
 3
3 -
 4
4 -
 5
5 -
 6
6 -
 7
7 -
 8
8 -
 9
9 -
 10
10 -
 11
11 -
 12
12 -
 13
13 -
 14
14 -
 15
15 -
 16
16 -
 17
17 -
18
-
19
-
20
-
21
-
22
-
23
-
24
-
25
-
26
-
27
-
28
-
29
-
30
-
31
-
32
-
33
-
34
-
35
-
36
-
37
-
38
-
39
-
40
-
41
-
42
-
43
-
44
-
45
-
46
-
47
-
48
-
49
-
50
-
51
-
52
-
53
-
54
-
55
-
56
-
57
-
58
-
59
-
60
-
61
-
62
-
63
-
64
-
65
-
66
-
67
-
68
-
69
-
70
-
71
-
72
-
73
-
74
-
75
-
76
-
77
-
78
-
79
-
80
-
81
-
82
-
83
-
84
-
85
-
86
-
87
-
88
-
89
-
90
-
91
-
92
-
93
-
94
-
95
-
96
-
97
-
98
-
99
-
100
 |
 |

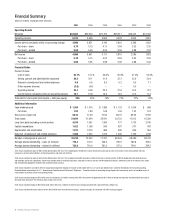
Financial Summary
(Dollars in millions, except per share amounts)
2007 2006 2005 2004 2003 2002
Operating Results
Net sales $24,462 $22,923 $21,167 $20,011 $18,232 $16,332
Operating income 6,193 5,696 4,854 4,326 3,504 2,816
Income before cumulative effect of accounting change 4,096 3,851 3,146 2,841 2,286 1,832
Per share – basic 5.70 5.15 4.11 3.64 2.92 2.35
Per share – diluted 5.60 5.06 4.03 3.56 2.88 2.32
Net income 4,096 3,851 3,111 2,841 2,286 1,832
Per share – basic 5.70 5.15 4.07 3.64 2.92 2.35
Per share – diluted 5.60 5.06 3.98 3.56 2.88 2.32
Financial Ratios
Percent of sales
Cost of sales 52.1% 51.1% 49.2% 50.0% 51.2% 52.3%
Selling, general and administrative expenses 20.5 22.1 21.9 22.2 22.6 23.4
Research, development and related expenses 5.6 6.6 6.0 6.2 6.5 7.1
Other expense (income) (3.5) (4.6) – – 0.5 –
Operating income 25.3 24.8 22.9 21.6 19.2 17.2
Income before cumulative effect of accounting change 16.7 16.8 14.9 14.2 12.5 11.2
Total debt to total capital (total capital = debt plus equity) 30% 26% 19% 21% 27% 35%
Additional Information
Cash dividends paid $ 1,380 $ 1,376 $ 1,286 $ 1,125 $ 1,034 $ 968
Per share 1.92 1.84 1.68 1.44 1.32 1.24
Stock price at year-end 84.32 77.93 77.50 82.07 85.03 61.65
Total assets 24,694 21,294 20,541 20,723 17,612 15,339
Long-term debt (excluding current portion) 4,019 1,047 1,309 727 1,735 2,140
Capital expenditures 1,422 1,168 943 937 677 763
Depreciation and amortization 1,072 1,079 986 999 964 954
Research, development and related expenses 1,368 1,522 1,274 1,246 1,190 1,158
Number of employees at year-end 76,239 75,333 71,227 68,244 68,089 69,720
Average shares outstanding – basic (in millions) 718.3 747.5 764.9 780.5 782.8 780.0
Average shares outstanding – diluted (in millions) 732.0 761.0 781.3 797.3 794.1 789.2
2007 results included net gains of $681 million ($448 million after tax). This included gains related to the sale of businesses and a gain on sale of real estate, which were partially offset by
increases in environmental liabilities, restructuring actions and other exit activities.
2006 results included net gains of $523 million ($438 million after tax). This included net benefits from gains related to the sale of certain portions of 3M’s branded pharmaceuticals business
and favorable income tax adjustments, which were partially offset by restructuring actions, acquired in-process research and development expenses, settlement costs of an antitrust class action,
and environmental obligations related to the pharmaceuticals business.
2005 results included a cumulative effect of accounting change that reduced net income by $35 million after tax, or 5 cents per diluted share, related to the adoption of Financial Accounting
Standards Board Interpretation No. 47, “Accounting for Conditional Asset Retirement Obligations.” Cumulative effect of accounting change impacts net income only, and is not included as part of
income before cumulative effect of accounting change.
2005 results included charges of $75 million after tax related to a tax liability resulting from 3M’s reinvestment of approximately $1.7 billion of foreign earnings into the United States pursuant to
the repatriation provision of the American Jobs Creation Act of 2004.
2003 results included charges of $93 million ($58 million after tax), related to an adverse court ruling associated with a lawsuit filed by LePage’s Inc.
2002 results included net losses of $202 million ($108 million after tax and minority interest), related to charges in connection with 3M’s restructuring plan.
Leading Through Innovation 4