AT&T Wireless 2008 Annual Report Download - page 62
Download and view the complete annual report
Please find page 62 of the 2008 AT&T Wireless annual report below. You can navigate through the pages in the report by either clicking on the pages listed below, or by using the keyword search tool below to find specific information within the annual report.-
 1
1 -
2
-
3
-
4
-
5
-
6
-
7
-
8
-
9
-
10
-
11
-
12
-
13
-
14
-
15
-
16
-
17
-
18
-
19
-
20
-
21
-
22
-
23
-
24
-
25
-
26
-
27
-
28
-
29
-
30
-
31
-
32
-
33
-
34
-
35
-
36
-
37
-
38
-
39
-
40
-
41
-
42
-
43
-
44
-
45
-
46
-
47
-
48
-
49
-
50
-
51
-
 52
52 -
 53
53 -
 54
54 -
 55
55 -
 56
56 -
 57
57 -
 58
58 -
 59
59 -
 60
60 -
 61
61 -
 62
62 -
 63
63 -
 64
64 -
 65
65 -
 66
66 -
 67
67 -
 68
68 -
 69
69 -
 70
70 -
 71
71 -
 72
72 -
73
-
74
-
75
-
76
-
77
-
78
-
79
-
80
-
81
-
82
-
83
-
84
 |
 |

Notes to Consolidated Financial Statements (continued)
Dollars in millions except per share amounts
60
| AT&T Annual Report 2008
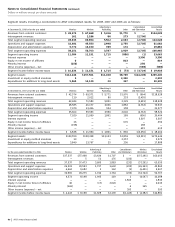
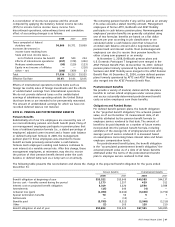
Segment results, including a reconciliation to AT&T consolidated results, for 2008, 2007 and 2006 are as follows:
Advertising & Consolidation Consolidated
At December 31, 2008 or for the year ended Wireless Wireline Publishing Other and Elimination Results
Revenues from external customers $ 49,174 $ 67,668 $ 5,416 $1,770 $ — $124,028
Intersegment revenues 161 2,186 86 273 (2,706) —
Total segment operating revenues 49,335 69,854 5,502 2,043 (2,706) 124,028
Operations and support expenses 32,481 45,553 2,998 2,755 (2,705) 81,082
Depreciation and amortization expenses 5,770 13,150 789 174 — 19,883
Total segment operating expenses 38,251 58,703 3,787 2,929 (2,705) 100,965
Segment operating income 11,084 11,151 1,715 (886) (1) 23,063
Interest expense — — — — 3,390 3,390
Equity in net income of affiliates 6 — — 813 — 819
Minority interest (256) — — — 256 —
Other income (expense) – net — — — — (589) (589)
Segment income before income taxes $ 10,834 $ 11,151 $ 1,715 $ (73) $ (3,724) $ 19,903
Segment assets $112,146 $157,501 $11,038 $8,769 $(24,209) $265,245
Investment in equity method investees 2 — — 2,330 — 2,332
Expenditures for additions to long-lived assets 5,869 14,129 20 317 — 20,335
Advertising & Consolidation Consolidated
At December 31, 2007 or for the year ended Wireless Wireline Publishing Other and Elimination Results
Revenues from external customers $ 42,574 $ 69,571 $ 5,771 $1,976 $ (964) $118,928
Intersegment revenues 110 2,012 80 253 (2,455) —
Total segment operating revenues 42,684 71,583 5,851 2,229 (3,419) 118,928
Operations and support expenses 28,585 46,177 3,066 1,882 (2,763) 76,947
Depreciation and amortization expenses 7,079 13,416 924 158 — 21,577
Total segment operating expenses 35,664 59,593 3,990 2,040 (2,763) 98,524
Segment operating income 7,020 11,990 1,861 189 (656) 20,404
Interest expense — — — — 3,507 3,507
Equity in net income (loss) of affiliates 16 — — 676 — 692
Minority interest (198) — — — 198 —
Other income (expense) – net — — — — 615 615
Segment income before income taxes $ 6,838 $ 11,990 $ 1,861 $ 865 $(3,350) $ 18,204
Segment assets $103,559 $158,338 $13,103 $2,859 $(2,215) $275,644
Investment in equity method investees 13 — — 2,257 — 2,270
Expenditures for additions to long-lived assets 3,840 13,767 25 256 — 17,888
Advertising & Consolidation Wireless Consolidated
For the year ended December 31, 2006 Wireless Wireline Publishing Other and Elimination Elimination Results
Revenues from external customers $37,537 $57,468 $3,634 $1,707 $ — $(37,291) $63,055
Intersegment revenues — 5 51 176 (232) — —
Total segment operating revenues 37,537 57,473 3,685 1,883 (232) (37,291) 63,055
Operations and support expenses 26,503 39,593 1,737 1,602 (232) (26,343) 42,860
Depreciation and amortization expenses 6,462 9,682 3 162 (1) (6,401) 9,907
Total segment operating expenses 32,965 49,275 1,740 1,764 (233) (32,744) 52,767
Segment operating income 4,572 8,198 1,945 119 1 (4,547) 10,288
Interest expense — — — — 1,843 — 1,843
Equity in net income (loss) of affiliates 40 — (17) 2,020 — — 2,043
Minority interest (169) — — — 4 165 —
Other income (expense) – net — — — — 393 — 393
Segment income before income taxes $ 4,443 $ 8,198 $1,928 $2,139 $(1,445) $ (4,382) $10,881