AT&T Wireless 2010 Annual Report Download - page 36
Download and view the complete annual report
Please find page 36 of the 2010 AT&T Wireless annual report below. You can navigate through the pages in the report by either clicking on the pages listed below, or by using the keyword search tool below to find specific information within the annual report.-
 1
1 -
2
-
3
-
4
-
5
-
6
-
7
-
8
-
9
-
10
-
11
-
12
-
13
-
14
-
15
-
16
-
17
-
18
-
19
-
20
-
21
-
22
-
23
-
24
-
25
-
 26
26 -
 27
27 -
 28
28 -
 29
29 -
 30
30 -
 31
31 -
 32
32 -
 33
33 -
 34
34 -
 35
35 -
 36
36 -
 37
37 -
 38
38 -
 39
39 -
 40
40 -
 41
41 -
 42
42 -
 43
43 -
 44
44 -
 45
45 -
 46
46 -
47
-
48
-
49
-
50
-
51
-
52
-
53
-
54
-
55
-
56
-
57
-
58
-
59
-
60
-
61
-
62
-
63
-
64
-
65
-
66
-
67
-
68
-
69
-
70
-
71
-
72
-
73
-
74
-
75
-
76
-
77
-
78
-
79
-
80
-
81
-
82
-
83
-
84
-
85
-
86
-
87
-
88
-
89
-
90
-
91
-
92
-
93
-
94
-
95
-
96
-
97
-
98
-
99
-
100
-
101
-
102
-
103
-
104
 |
 |

Management’s Discussion and Analysis of Financial Condition and Results of Operations (continued)
Dollars in millions except per share amounts
34 AT&T Inc.
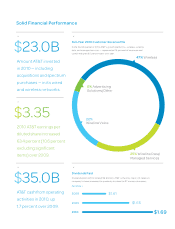
Average service revenue per user (ARPU) declined 1.8%
in 2010, reflecting strong growth in connected devices and
tablet subscribers, who typically have a lower ARPU compared
to ARPU generated by our other customers. ARPU growth
was flat in 2009, due to increased data services ARPU growth
offsetting declining voice and other service ARPU. Data
services ARPU increased 14.7% in 2010 and 22.0% in 2009.
We expect continued revenue growth from data services, as
more customers purchase integrated devices and data-centric
devices, and as we continue to expand our network. Voice and
other service ARPU declined 8.6% and 6.5% in 2010 and 2009.
ARPU from postpaid customers increased 2.9% in 2010 and
2.8% in 2009, reflecting usage of more advanced integrated
devices by these customers, evidenced by an increase in
postpaid data services ARPU of 19.3% in 2010 and 23.7%
in 2009. Of our total postpaid customers, 61.0% now use
integrated devices, up from 46.8% a year earlier. The growth
in postpaid data services ARPU in 2010 and 2009 was
partially offset by a 4.1% decrease in 2010 and a 4.0%
decrease in 2009 in postpaid voice and other service ARPU.
Wireless Metrics
Customer Additions As of December 31, 2010, we served
95.5 million wireless customers. Higher net customer additions
(net additions) in 2010 and 2009 were primarily attributable
to higher net connected devices additions and additions in
our reseller customer business. Connected devices, such as
eReaders, security systems, fleet management and global
positioning systems, as well as tablets (predominantly
reflected in our prepaid customer category) are data-centric
devices, with customers typically on lower-priced data-only
plans compared with customers on our postpaid plans.
During 2010, we also continued to see an increase in gross
and net additions related to the sale of integrated devices
(handsets which allow Internet access as well as voice).
Lower net postpaid additions in 2010 and 2009 reflected
slowing growth in the industry subscriber base and lower
postpaid churn throughout the industry. We expect revenue
growth to continue to shift from voice toward data revenues
with increasing penetration rates for integrated devices
and additional sales of data-centric devices.
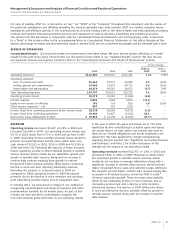
Wireless
Segment Results
Percent Change
2010 vs. 2009 vs.
2010 2009 2008 2009 2008
Segment operating revenues
Service $53,510 $48,563 $44,249 10.2% 9.7%
Equipment 4,990 4,941 4,925 1.0 0.3
Total Segment Operating Revenues 58,500 53,504 49,174 9.3 8.8
Segment operating expenses
Operations and support 36,746 33,631 31,530 9.3 6.7
Depreciation and amortization 6,497 6,043 6,025 7.5 0.3
Total Segment Operating Expenses 43,243 39,674 37,555 9.0 5.6
Segment Operating Income 15,257 13,830 11,619 10.3 19.0
Equity in Net Income of Affiliates 9 9 6 — 50.0
Segment Income $15,266 $13,839 $11,625 10.3% 19.0%
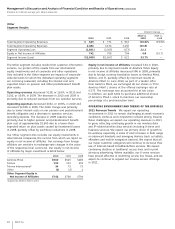
The following table highlights other key measures of performance for the Wireless segment:
2010 vs. 2009 vs.
2010 2009 2008 2009 2008
Wireless Customers (000) 95,536 85,120 77,009 12.2% 10.5%
Net Customer Additions (000)1 8,853 7,278 6,699 21.6% 8.6%
Total Churn 1.31% 1.47% 1.70% (16) BP (23) BP
Postpaid Customers (000) 68,041 64,627 59,653 5.3% 8.3%
Net Postpaid Customer Additions (000)1 2,153 4,199 4,523 (48.7)% (7.2)%
Postpaid Churn 1.09% 1.13% 1.18% (4) BP (5) BP
Prepaid Customers (000) 6,524 5,350 6,106 21.9% (12.4)%
Net Prepaid Customer Additions (000)1 952 (801) 71 — —
Reseller Customers (000) 11,645 10,439 8,589 11.6% 21.5%
Net Reseller Customer Additions (000)1 1,140 1,803 1,102 (36.8)% 63.3%
Connected Device Customers (000) 9,326 4,704 2,661 98.3% 76.8%
Net Connected Device Customer Additions (000) 4,608 2,077 1,003 — —
1Excludes merger and acquisition-related additions during the period.