AT&T Wireless 2012 Annual Report Download - page 36
Download and view the complete annual report
Please find page 36 of the 2012 AT&T Wireless annual report below. You can navigate through the pages in the report by either clicking on the pages listed below, or by using the keyword search tool below to find specific information within the annual report.-
 1
1 -
2
-
3
-
4
-
5
-
6
-
7
-
8
-
9
-
10
-
11
-
12
-
13
-
14
-
15
-
16
-
17
-
18
-
19
-
20
-
21
-
22
-
23
-
24
-
25
-
 26
26 -
 27
27 -
 28
28 -
 29
29 -
 30
30 -
 31
31 -
 32
32 -
 33
33 -
 34
34 -
 35
35 -
 36
36 -
 37
37 -
 38
38 -
 39
39 -
 40
40 -
 41
41 -
 42
42 -
 43
43 -
 44
44 -
 45
45 -
 46
46 -
47
-
48
-
49
-
50
-
51
-
52
-
53
-
54
-
55
-
56
-
57
-
58
-
59
-
60
-
61
-
62
-
63
-
64
-
65
-
66
-
67
-
68
-
69
-
70
-
71
-
72
-
73
-
74
-
75
-
76
-
77
-
78
-
79
-
80
-
81
-
82
-
83
-
84
-
85
-
86
-
87
-
88
-
89
-
90
-
91
-
92
-
93
-
94
-
95
-
96
-
97
-
98
-
99
-
100
 |
 |

Management’s Discussion and Analysis of Financial Condition and Results of Operations (continued)
Dollars in millions except per share amounts
34 | AT&T Inc.
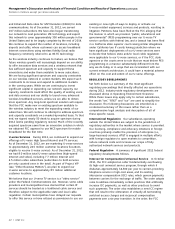
Wireless
Segment Results
Percent Change
2012 vs. 2011 vs.
2012 2011 2010 2011 2010
Segment operating revenues
Service $59,186 $56,726 $53,510 4.3% 6.0%
Equipment 7,577 6,489 4,991 16.8 30.0
Total Segment Operating Revenues 66,763 63,215 58,501 5.6 8.1
Segment operating expenses
Operations and support 43,296 41,282 36,185 4.9 14.1
Depreciation and amortization 6,873 6,329 6,498 8.6 (2.6)
Total Segment Operating Expenses 50,169 47,611 42,683 5.4 11.5
Segment Operating Income 16,594 15,604 15,818 6.3 (1.4)
Equity in Net Income (Loss) of Affiliates (62) (29) 9 — —
Segment Income $16,532 $15,575 $15,827 6.1% (1.6)%
The following table highlights other key measures of performance for the Wireless segment:
2012 vs. 2011 vs.
2012 2011 2010 2011 2010
Wireless Subscribers (000)1 106,957 103,247 95,536 3.6% 8.1%
Gross Subscriber Additions (000)2 20,770 23,869 22,879 (13.0) 4.3
Net Subscriber Additions (000)2 3,764 7,699 8,853 (51.1) (13.0)
Total Churn4 1.35% 1.37% 1.31% (2) BP 6 BP
Postpaid Subscribers (000) 70,497 69,309 68,041 1.7% 1.9%
Net Postpaid Subscriber Additions (000)2 1,438 1,429 2,153 0.6 (33.6)
Postpaid Churn4 1.09% 1.18% 1.09% (9) BP 9 BP
Prepaid Subscribers (000) 7,328 7,225 6,524 1.4% 10.7%
Net Prepaid Subscriber Additions (000)2 128 674 952 (81.0) (29.2)
Reseller Subscribers (000) 14,875 13,644 11,645 9.0 17.2
Net Reseller Subscriber Additions (000)2 1,027 1,874 1,140 (45.2) 64.4
Connected Device Subscribers (000)3 14,257 13,069 9,326 9.1 40.1
Net Connected Device Subscriber Additions (000) 1,171 3,722 4,608 (68.5)% (19.2)%
1Represents 100% of AT&T Mobility wireless subscribers.
2Excludes merger and acquisition-related additions during the period.
3
Includes data-centric devices such as eReaders, tablets, automobile monitoring systems, and fleet management.
4 Calculated by dividing the aggregate number of wireless subscribers who canceled service during a period divided by the total number of wireless subscribers at the
beginning of that period. The churn rate for the period is equal to the average of the churn rate for each month of that period.
from nine manufacturers. As technology evolves, rapid changes
are occurring in the handset and device industry with the
continual introduction of new models or significant revisions of
existing models. We believe a broad offering of a wide variety
of smartphones reduces dependence on any single operating
system or manufacturer as these products continue to evolve
in terms of technology and subscriber appeal. In 2012, we
continued to see an increasing use of smartphones by our
postpaid subscribers. Of our total postpaid subscriber base,
66.8% (or 47.1 million subscribers) use smartphones, up from
56.8% (or 39.4 million subscribers) a year earlier and 42.7% (or
29.1 million subscribers) two years ago. As is common in the
Wireless Subscriber Relationships
As the wireless industry continues to mature, we believe that
future wireless growth will increasingly depend on our ability
to offer innovative services and devices and a wireless
network that has sufficient spectrum and capacity to support
these innovations and make them available to more
subscribers. To attract and retain subscribers, we offer a
broad handset line and a wide variety of service plans.
Our handset offerings include at least 16 smartphones
(handsets with voice and data capabilities using an advanced
operating system to better manage data and Internet access)