American Airlines 2011 Annual Report Download - page 171
Download and view the complete annual report
Please find page 171 of the 2011 American Airlines annual report below. You can navigate through the pages in the report by either clicking on the pages listed below, or by using the keyword search tool below to find specific information within the annual report.-
 1
1 -
2
-
3
-
4
-
5
-
6
-
7
-
8
-
9
-
10
-
11
-
12
-
13
-
14
-
15
-
16
-
17
-
18
-
19
-
20
-
21
-
22
-
23
-
24
-
25
-
26
-
27
-
28
-
29
-
30
-
31
-
32
-
33
-
34
-
35
-
36
-
37
-
38
-
39
-
40
-
41
-
42
-
43
-
44
-
45
-
46
-
47
-
48
-
49
-
50
-
51
-
52
-
53
-
54
-
55
-
56
-
57
-
58
-
59
-
60
-
61
-
62
-
63
-
64
-
65
-
66
-
67
-
68
-
69
-
70
-
71
-
72
-
73
-
74
-
75
-
76
-
77
-
78
-
79
-
80
-
81
-
82
-
83
-
84
-
85
-
86
-
87
-
88
-
89
-
90
-
91
-
92
-
93
-
94
-
95
-
96
-
97
-
98
-
99
-
100
-
101
-
102
-
103
-
104
-
105
-
106
-
107
-
108
-
109
-
110
-
111
-
112
-
113
-
114
-
115
-
116
-
117
-
118
-
119
-
120
-
121
-
122
-
123
-
124
-
125
-
126
-
127
-
128
-
129
-
130
-
131
-
132
-
133
-
134
-
135
-
136
-
137
-
138
-
139
-
140
-
141
-
142
-
143
-
144
-
145
-
146
-
147
-
148
-
149
-
150
-
151
-
152
-
153
-
154
-
155
-
156
-
157
-
158
-
159
-
160
-
 161
161 -
 162
162 -
 163
163 -
 164
164 -
 165
165 -
 166
166 -
 167
167 -
 168
168 -
 169
169 -
 170
170 -
 171
171 -
 172
172 -
 173
173 -
 174
174 -
 175
175 -
 176
176 -
 177
177
 |
 |
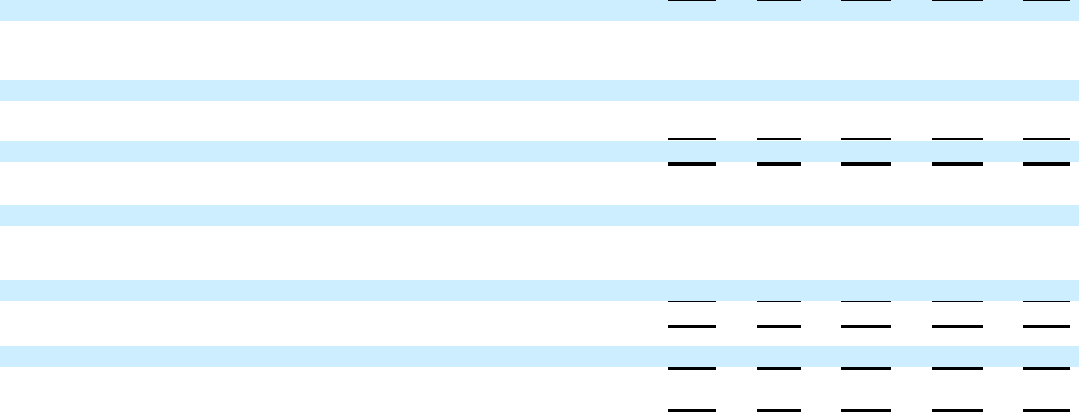
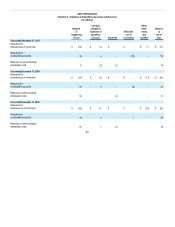
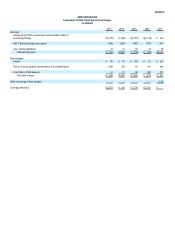
Exhibit 12
AMR CORPORATION
Computation of Ratio of Earnings to Fixed Charges
(in millions)
2011 2010 2009 2008 2007
Earnings:
Income (loss) before income taxes and cumulative effect of
accounting change $(1,979) $(506) $(1,752) $(2,118) $ 456
Add: Total fixed charges (per below) 1,899 1,804 1,662 1,678 1,876
Less: Interest capitalized 40 31 42 33 20
Total earnings (loss) $(120) $1,267 $(132) $(473) $2,312
Fixed charges:
Interest $780 $775 $ 689 $703 $857
Portion of rental expense representative of the interest factor 1,049 958 877 847 898
Amortization of debt expense 70 71 96 128 121
Total fixed charges $1,899 $1,804 $1,662 $1,678 $1,876
Ratio of earnings to fixed charges - - - - 1.23
Coverage deficiency $2,019 $537 $1,794 $2,151 $-