Avon 2001 Annual Report Download - page 9
Download and view the complete annual report
Please find page 9 of the 2001 Avon annual report below. You can navigate through the pages in the report by either clicking on the pages listed below, or by using the keyword search tool below to find specific information within the annual report.-
 1
1 -
 2
2 -
 3
3 -
 4
4 -
 5
5 -
 6
6 -
 7
7 -
 8
8 -
 9
9 -
 10
10 -
 11
11 -
 12
12 -
 13
13 -
 14
14 -
 15
15 -
 16
16 -
 17
17 -
 18
18 -
 19
19 -
 20
20 -
21
-
22
-
23
-
24
-
25
-
26
-
27
-
28
-
29
-
30
-
31
-
32
-
33
-
34
-
35
-
36
-
37
-
38
-
39
-
40
-
41
-
42
-
43
-
44
-
45
-
46
-
47
-
48
-
49
 |
 |

PAGE 32
strengthening of the euro and Polish zloty against the
British pound, and an investment in supply chain
Business Transformation initiatives including expenses
associated with the closing of a manufacturing facility.
• In Western Europe, excluding the United Kingdom, oper-
ating margin declined (which reduced segment margin
by 1.3 points) primarily due to a lower gross margin, most
significantly in Germany, due to strategic pricing invest-
ments, increased consumer investments, an unfavorable
product mix, and higher expense ratios in Germany and
Italy as a result of fixed costs on a lower sales base.
Operating margin also improved due to greater con-
tributions from countries with higher operating margins
(which increased segment margin by 1.0 point).
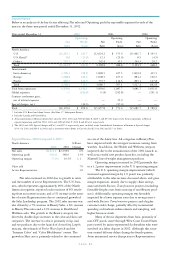
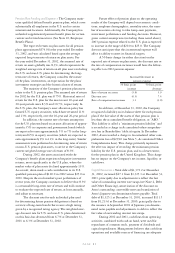
Pacific %/Point Change
Local
2002 2001 US$ Currency
Net sales $829.7 $773.7 7% 8%
Operating profit 133.9 112.6 19% 19%
Operating margin 15.9% 14.3% 1.6 1.6
Units sold 19%
Active Representatives 6%
Net sales in U.S. dollars and local currency
increased as a result of growth in most major markets in
the region, driven primarily by increases in units and
active Representatives.
• In China, Net sales in U.S. dollars and local currency
increased primarily due to a continued increase in the
number of Avon beauty boutiques.
• In Japan, Net sales in U.S dollars were flat due to the
negative impact of foreign exchange and a weak eco-
nomic environment, but increased in local currency
driven by an increase in active Representatives and
aggressive sales and merchandising programs.
• In the Philippines, Net sales in U.S. dollars were flat
due to the negative impact of foreign exchange, but
increased in local currency due to an increase in active
Representatives, partially offset by the impact of the
depressed economic situation in the country.
The increase in operating margin in the Pacific was
most significantly impacted by the following markets:
• In China, operating margin improved (which increased
segment margin by 1.4 points) primarily due to a lower
expense ratio resulting from operating expense leverage
as this market achieves scale, partially offset by incre-
mental advertising expenses. Operating margin was
negatively impacted by a decline in gross margin result-
ing from aggressive pricing and merchandising to
increase market share.
• In Japan, operating margin improved (which increased
segment margin by .6 point) resulting primarily from
gross margin expansion due to a favorable mix of prod-
ucts sold and a lower expense ratio due to general cost
containment initiatives.
• In the Philippines, operating margin decreased (which
decreased segment margin by .5 point) due to a decrease
in gross margin resulting from an unfavorable mix of
products sold, and a higher expense ratio due to
increased sales incentives, higher bad debt expense and
incremental spending on sampling.
Global Expenses > Global expenses increased $7.0 in
2002 primarily due to incremental investments of $12.2
for research and development and global marketing, as
well as a new Teen product line (which is due to launch in
late 2003), higher bonus accruals of $9.2, merit salary
increases of approximately $4.0, and severance accruals of
$3.1 for employees not included in the 2002 Special
charges. These increases were partially offset by net sav-
ings of approximately $23.0 from workforce reductions
associated with Avon’s Business Transformation initiatives.
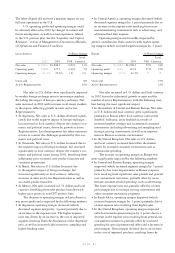
Segment Review–2001 Compared to 2000 >
North America %/Point
2001 2000 Change
Net sales $2,278.9 $2,154.5 6%
Operating profit 380.6 368.2 3%
Operating margin 16.5% 16.9% (.4)
Units sold 5%
Active Representatives 3%
Net sales in North America grew primarily due to
sales growth of 6% in the U.S. business, which represents
almost 90% of the North American segment.
The sales increase in the U.S. resulted from a 3%
increase in the number of active Representatives due to the
successful implementation of Avon’s Representative devel-
opment strategies, particularly Sales Leadership, as well as
the strength of Avon’s marketing plans. The 2001 sales
increase was also driven by a 6% growth in units due to
the success of new product launches, including the Kiss
Goodbye to Breast Cancer lipstick campaign, and inventory
clearance programs, partially offset by a temporary pause
in Representative recruitment resulting from the events
of September 11th.
Operating margin in North America declined 0.4
point in 2001 primarily due to investments associated
with the launch of the U.S. Retail business (which reduced
segment margin by .9 point), partially offset by an
improvement in the U.S.
The U.S. operating margin improved (which
increased segment margin by .3 point) due to an increase
in gross margin, the realization of certain process redesign
savings and a favorable comparison to 2000 operating
results which were negatively impacted by the costs asso-
ciated with exiting certain Avon-owned Beauty Centers.
Such improvements more than offset the higher 2001
investments associated with the launch of the Health and
Wellness business and the U.S. Internet initiative.