Avon 2003 Annual Report Download - page 1
Download and view the complete annual report
Please find page 1 of the 2003 Avon annual report below. You can navigate through the pages in the report by either clicking on the pages listed below, or by using the keyword search tool below to find specific information within the annual report.-
 1
1 -
 2
2 -
 3
3 -
 4
4 -
 5
5 -
 6
6 -
 7
7 -
 8
8 -
 9
9 -
 10
10 -
 11
11 -
 12
12 -
13
-
14
-
15
-
16
-
17
-
18
-
19
-
20
-
21
-
22
-
23
-
24
-
25
-
26
-
27
-
28
-
29
-
30
-
31
-
32
-
33
-
34
-
35
-
36
-
37
-
38
-
39
-
40
-
41
-
42
-
43
-
44
-
45
-
46
-
47
-
48
-
49
-
50
-
51
-
52
-
53
-
54
-
55
-
56
-
57
-
58
-
59
-
60
-
61
-
62
-
63
-
64
-
65
-
66
-
67
-
68
-
69
-
70
-
71
-
72
-
73
-
74
-
75
-
76
-
77
-
78
-
79
-
80
-
81
-
82
-
83
-
84
-
85
 |
 |

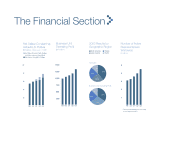
The Financial Section
2
4
6
8
10
8
10
99 00 01 02 03
250
500
750
1000
1250
1500
99 00 01 02 03
2003 Results by
Geographic Region
Net Sales
37%
Business Unit Operating Profit
33%
12 %
13%
■Europe
■Pacific
■North America
■Latin America
24%
26%
24%
31%
Number of Active
Representatives
Worldwide
In millions
* Revised methodology for calculating
active Representatives
1
2
3
4
5
99 00* 01* 02* 03*