Avon 2005 Annual Report Download - page 11
Download and view the complete annual report
Please find page 11 of the 2005 Avon annual report below. You can navigate through the pages in the report by either clicking on the pages listed below, or by using the keyword search tool below to find specific information within the annual report.-
 1
1 -
 2
2 -
 3
3 -
 4
4 -
 5
5 -
 6
6 -
 7
7 -
 8
8 -
 9
9 -
 10
10 -
 11
11 -
 12
12 -
 13
13 -
 14
14 -
 15
15 -
 16
16 -
 17
17 -
 18
18 -
 19
19 -
 20
20 -
 21
21 -
 22
22 -
23
-
24
-
25
-
26
-
27
-
28
-
29
-
30
-
31
-
32
-
33
-
34
-
35
-
36
-
37
-
38
-
39
-
40
-
41
-
42
-
43
-
44
-
45
-
46
-
47
-
48
-
49
-
50
-
51
-
52
-
53
-
54
-
55
-
56
-
57
 |
 |

2005ANNUALREPORT31
North American operating margin declined primarily due to a
decline in U.S. gross margin. The U.S. gross margin decline was
due to the unfavorable impacts of pricing and product mix, includ-
ing the national roll-out of an intimate apparel line. Additionally,
the expense ratio was negatively impacted by lower revenue
combined with costs to implement restructuring initiatives.
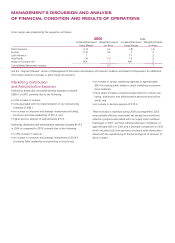
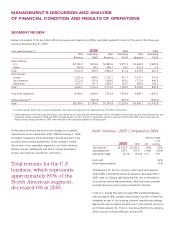
North America – 2004 Compared to 2003
%/Point Change
Local
2004 2003 US$ Currency
Total revenue $2,632.3 $2,574.5 2% 1%
Operating profit 411.4 425.9 (3)% (3)%
Operating margin 15.6% 16.5% (.9) (.9)
Units sold 3%
Active Representatives 1%
Total revenue was flat for the U.S. business in 2004, which repre-
sents approximately 90% of the North American segment, reflect-
ing a slower second half driven in part by a decline in consumer
spending. Additionally, revenue was impacted by challenges
in the Beyond Beauty category and a lower number of active
Representatives during the second half of 2004.
On a category basis, 2004 sales in the U.S. were impacted by
increases in Beauty sales of 3% (dampened by the consumer
slowdown in the second half of 2004) and Beauty Plus sales of 2%,
offset by a decrease of 9% in the Beyond Beauty category (driven by
the strategic downsizing of toys, declines in home entertainment, as
well as softness in gifts which were repositioned in 2005).
The decrease in operating margin in North America was most
significantly impacted by the following:
• Operating margin in the U.S. declined (which decreased seg-
ment margin by 1.8 points) mainly due to a decline in gross
margin resulting from the following:
• inventory clearance programs in the first quarter of 2004,
• repositioning costs related to Beyond Beauty, specifically
inventory write-offs for toys, and
• higher costs for fuel, warehousing and storage.
The declines were partially offset by higher Representative fees
and a favorable mix of products sold. Additionally, operating
margin was negatively impacted by an unfavorable expense ratio,
resulting from higher pension, bad debt and shipping expenses.
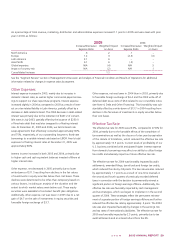
Europe – 2005 Compared to 2004
%/Point Change
Local
2005 2004 US$ Currency
Total revenue $2,291.4 $2,102.2 9% 7%
Operating profit 458.9 471.7 (3)% (6)%
Operating margin 20.0% 22.4% (2.4) (2.7)
Units sold 5%
Active Representatives 9%
Total revenue increased in 2005 reflecting growth in active
Representatives and units sold, as well as favorable foreign exchange.
• In Central and Eastern Europe, revenue grew 15% (which
increased segment revenue by 8%) driven by revenue growth
in Russia of 17%, reflecting growth in active Representatives.
Growth rates decelerated in Central and Eastern Europe as the
scale of the markets and competitive intensity increased.
• Turkey continued to grow revenues, driven by high growth in
both active Representatives and units sold.
• Revenue decreased in the United Kingdom due to a smaller
average order per active Representative, reflecting an economy
adversely impacted by higher interest rates, rising fuel costs and
lower disposable income, as well as increased competition.
Operating margin suffered from investment in overhead and
expenses to support an operating model that was built for an
expectation of growth that did not materialize. Operating margin
declined due to a decline in gross margin of 1.2 points, reflecting
unfavorable pricing and product mix, and higher manufactur-
ing overhead, and an increase in the expense ratio of 1.2 points
primarily due to costs to implement organization realignments
throughout the region, including a financial shared services center,
under our restructuring initiatives. The decrease in operating mar-
gin in Europe was most significantly impacted by the following:
• In Western Europe, operating margin declined (which decreased
segment margin by 1.0 point) mainly due to the United Kingdom,
reflecting the negative impact on profitability from the decline in
revenues compared to the prior year.
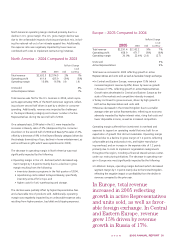
In Europe, total revenue
increased in 2005 reflecting
growth in active Representatives
and units sold, as well as favor-
able foreign exchange. In Central
and Eastern Europe, revenue
grew 15% driven by revenue
growth in Russia of 17%.