BP 2005 Annual Report Download - page 12
Download and view the complete annual report
Please find page 12 of the 2005 BP annual report below. You can navigate through the pages in the report by either clicking on the pages listed below, or by using the keyword search tool below to find specific information within the annual report.-
 1
1 -
 2
2 -
 3
3 -
 4
4 -
 5
5 -
 6
6 -
 7
7 -
 8
8 -
 9
9 -
 10
10 -
 11
11 -
 12
12 -
 13
13 -
 14
14 -
 15
15 -
 16
16 -
 17
17 -
 18
18 -
 19
19 -
 20
20 -
 21
21 -
 22
22 -
23
-
24
-
25
-
26
-
27
-
28
-
29
-
30
-
31
-
32
-
33
-
34
-
35
-
36
-
37
-
38
-
39
-
40
-
41
-
42
-
43
-
44
-
45
-
46
-
47
-
48
-
49
-
50
-
51
-
52
-
53
-
54
-
55
-
56
-
57
-
58
-
59
-
60
-
61
-
62
-
63
-
64
-
65
-
66
-
67
-
68
-
69
-
70
-
71
-
72
-
73
-
74
-
75
-
76
-
77
-
78
-
79
-
80
-
81
-
82
-
83
-
84
-
85
-
86
-
87
-
88
-
89
-
90
-
91
-
92
-
93
-
94
-
95
-
96
-
97
-
98
-
99
-
100
-
101
-
102
-
103
-
104
-
105
-
106
-
107
-
108
-
109
-
110
-
111
-
112
-
113
-
114
-
115
-
116
-
117
-
118
-
119
-
120
-
121
-
122
-
123
-
124
-
125
-
126
-
127
-
128
-
129
-
130
-
131
-
132
-
133
-
134
-
135
-
136
-
137
-
138
-
139
-
140
-
141
-
142
-
143
-
144
-
145
-
146
-
147
-
148
-
149
-
150
-
151
-
152
-
153
-
154
-
155
-
156
-
157
-
158
-
159
-
160
-
161
-
162
-
163
-
164
-
165
-
166
-
167
-
168
-
169
-
170
-
171
-
172
-
173
-
174
-
175
-
176
-
177
-
178
-
179
-
180
 |
 |

10 Making energy more
Financial performance
BUSINESS ENVIRONMENT
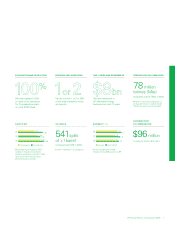
The trading environment in 2005 was stronger than in 2004,
with higher oil and gas realizations and higher refining and
olefins margins but lower retail marketing margins.
Crude oil prices reached record highs in 2005 in
nominal terms, driven by continued oil demand growth
and low surplus oil production capacity. The dated Brent
price averaged $54.48 per barrel, an increase of more
than $16 per barrel above the $38.27 per barrel average
seen in 2004, and varied between $38.21 and $67.33
per barrel. Hurricanes Katrina and Rita severely disrupted
oil and gas production in the Gulf of Mexico for an
extended period, but supply availability was maintained.
We test exploration and production projects at $25
per barrel but, in the light of oil market developments, we
also test them over a range of prices to ensure we maintain
a portfolio of activities with strong returns.
Natural gas prices in the US were also high during
2005 in the face of rising oil prices and hurricane-induced
production losses. The Henry Hub First of the Month Index
averaged $8.65 per million British thermal units (mmBtu),
up by around $2.50 per mmBtu compared with the 2004
average of $6.13 per mmBtu. High gas prices stimulated
a fall in demand, especially in the industrial sector. UK gas
prices were up strongly in 2005, averaging 40.71 pence
per therm at the National Balancing Point, compared with
a 2004 average of 24.39 pence per therm.
Refining margins also reached record highs in 2005, with
the BP global indicator margin (GIM) averaging $8.60 per
barrel. This reflected further oil demand growth and the loss of
refining capacity as a result of the US hurricanes. The premium
for light products above fuel oils remained exceptionally
high, favouring upgraded refineries over less complex sites.
Social responsibility risk Risk could arise if it is perceived
that we are not respecting or advancing the economic and
social progress of the communities in which we operate.
Environmental risk We seek to conduct our activities in
such a manner that there is no or minimal damage to
the environment. Risk could arise if we do not apply our
resources to overcome the perceived trade-off between
global access to energy and the protection or improvement
of the natural environment.
Compliance risk Incidents of non-compliance with
applicable laws and regulation or ethical misconduct could
be damaging to our reputation and shareholder value.
Inherent in our operations are hazards that require
continual oversight and control. If operational risks
materialized, loss of life, damage to the environment
or loss of production could result.
Drilling and production risk Exploration and production
require high levels of investment and have particular
economic risks and opportunities and may often involve
innovative technologies. They are subject to natural hazards
and other uncertainties, including those relating to the
physical characteristics of an oil or natural gas field. The cost
of drilling, completing or operating wells is often uncertain.
We may be required to curtail, delay or cancel drilling
operations because of a variety of factors, including
unexpected drilling conditions, pressure or irregularities
in geological formations, equipment failures or accidents,
adverse weather conditions and compliance with
governmental requirements.
Technical integrity risk There is a risk of loss of containment
of hydrocarbons and other hazardous material at operating
sites, pipelines or during transportation by road, rail or sea.
Security risk Acts of terrorism that threaten our plants
and offices, pipelines, transportation or computer systems
would severely disrupt business and operations.
RECONCILIATION OF PROFIT FOR THE PERIOD TO REPLACEMENT COST PROFIT
$ million
2005 2004 2003
Profit before interest and tax for continuing operations 32,682 25,746 18,776
Finance costs and other finance expense (761) (780) (1,045)
Taxation (9,473) (7,082) (5,050)
Minority interest (291) (187) (170)
Profit for the period for continuing operations attributable to BP shareholders 22,157 17,697 12,511
Profit (loss) for the period from Innovene operations 184 (622) (63)
Profit for the period attributable to BP shareholders 22,341 17,075 12,448
Inventory holding (gains) losses (3,027) (1,643) (16)
Replacement cost profita19,314 15,432 12,432
Replacement cost profit for continuing operations attributable to BP shareholders 19,513 16,336 12,460
Replacement cost profit for Innovene operations (199) (904) (28)
Replacement cost profit 19,314 15,432 12,432
Per ordinary share – cents
Profit for the period attributable to BP shareholders 105.74 78.24 56.14
Replacement cost profit 91.41 70.71 56.06
Dividends paid per ordinary share – cents 34.85 27.70 25.50
– pence 19.152 15.251 15.658
Dividends paid per American Depositary Share (ADS) – dollars 2.091 1.662 1.530
aReplacement cost profit reflects the current cost of supplies. The replacement cost profit for the period is determined by excluding from
profit inventory holding gains and losses. BP uses this measure to assist shareholders to assess BP’s performance from period to period.