BP 2007 Annual Report Download - page 9
Download and view the complete annual report
Please find page 9 of the 2007 BP annual report below. You can navigate through the pages in the report by either clicking on the pages listed below, or by using the keyword search tool below to find specific information within the annual report.-
 1
1 -
 2
2 -
 3
3 -
 4
4 -
 5
5 -
 6
6 -
 7
7 -
 8
8 -
 9
9 -
 10
10 -
 11
11 -
 12
12 -
 13
13 -
 14
14 -
 15
15 -
 16
16 -
 17
17 -
 18
18 -
 19
19 -
 20
20 -
21
-
22
-
23
-
24
-
25
-
26
-
27
-
28
-
29
-
30
-
31
-
32
-
33
-
34
-
35
-
36
-
37
-
38
-
39
-
40
-
41
-
42
-
43
-
44
-
45
-
46
-
47
-
48
-
49
-
50
-
51
-
52
-
53
-
54
-
55
-
56
-
57
-
58
-
59
-
60
-
61
-
62
-
63
-
64
-
65
-
66
-
67
-
68
-
69
-
70
-
71
-
72
-
73
-
74
-
75
-
76
-
77
-
78
-
79
-
80
-
81
-
82
-
83
-
84
-
85
-
86
-
87
-
88
-
89
-
90
-
91
-
92
-
93
-
94
-
95
-
96
-
97
-
98
-
99
-
100
-
101
-
102
-
103
-
104
-
105
-
106
-
107
-
108
-
109
-
110
-
111
-
112
-
113
-
114
-
115
-
116
-
117
-
118
-
119
-
120
-
121
-
122
-
123
-
124
-
125
-
126
-
127
-
128
-
129
-
130
-
131
-
132
-
133
-
134
-
135
-
136
-
137
-
138
-
139
-
140
-
141
-
142
-
143
-
144
-
145
-
146
-
147
-
148
-
149
-
150
-
151
-
152
-
153
-
154
-
155
-
156
-
157
-
158
-
159
-
160
-
161
-
162
-
163
-
164
-
165
-
166
-
167
-
168
-
169
-
170
-
171
-
172
-
173
-
174
-
175
-
176
-
177
-
178
-
179
-
180
-
181
-
182
-
183
-
184
-
185
-
186
-
187
-
188
-
189
-
190
-
191
-
192
-
193
-
194
-
195
-
196
-
197
-
198
-
199
-
200
-
201
-
202
-
203
-
204
-
205
-
206
-
207
-
208
-
209
-
210
-
211
-
212
 |
 |

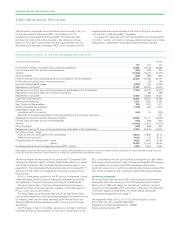
Performance review
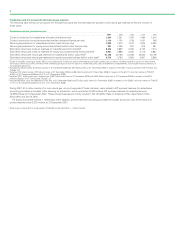
Selected financial and operating information
This information, insofar as it relates to 2007, has been extracted or
derived from the audited financial statements of the BP group presented
on pages 93-171. Note 1 to the Financial statements includes details on
the basis of preparation of these financial statements. The selected
information should be read in conjunction with the audited financial
statements and related Notes elsewhere herein.
BP sold its Innovene operations in December 2005. In the
circumstances of discontinued operations, IFRS require that the profits
earned by the discontinued operations, in this case the Innovene
operations, on sales to the continuing operations be eliminated on
consolidation from the discontinued operations and attributed to the
continuing operations and vice versa. This adjustment has two offsetting
elements: the net margin on crude refined by Innovene, as substantially
all crude for its refineries was supplied by BP and most of the refined
products manufactured by Innovene were taken by BP; and the
margin on sales of feedstock from BP’s US refineries to Innovene’s
manufacturing plants. The profits attributable to individual segments
are not affected by this adjustment. This representation does not
indicate the profits earned by continuing or Innovene operations, as if
they were standalone entities, for past periods or those likely to be
earned in future periods.
$ million except per share amounts
--------------------------------------------------------------------------------------------------------------------------------------------------------------------------------------------------------------------------------------------------------------------------------------------------------
2007 2006 2005 2004 2003
--------------------------------------------------------------------------------------------------------------------------------------------------------------------------------------------------------------------------------------------------------------------------------------------------------
Income statement data
Sales and other operating revenues from continuing operationsa284,365 265,906 239,792 192,024 164,653
Profit before interest and taxation from continuing operationsa32,352 35,158 32,682 25,746 18,776
Profit from continuing operationsa21,169 22,311 22,448 17,884 12,681
Profit for the year 21,169 22,286 22,632 17,262 12,618
Profit for the year attributable to BP shareholders 20,845 22,000 22,341 17,075 12,448
Capital expenditure and acquisitionsb20,641 17,231 14,149 16,651 19,623
Per ordinary share – cents
Profit for the year attributable to BP shareholders
Basic 108.76 109.84 105.74 78.24 56.14
Diluted 107.84 109.00 104.52 76.87 55.61
Profit from continuing operations attributable to BP shareholders
Basic 108.76 109.97 104.87 81.09 56.42
Diluted 107.84 109.12 103.66 79.66 55.89
Dividends paid per share – cents 42.30 38.40 34.85 27.70 25.50
–pence 20.995 21.104 19.152 15.251 15.658
Ordinary share datac
Average number outstanding of 25 cent ordinary shares (shares million undiluted) 19,163 20,028 21,126 21,821 22,171
Average number outstanding of 25 cent ordinary shares (shares million diluted) 19,327 20,195 21,411 22,293 22,424
Balance sheet data
Total assets 236,076 217,601 206,914 194,630 172,491
Net assets 94,652 85,465 80,765 78,235 70,264
Share capital 5,237 5,385 5,185 5,403 5,552
BP shareholders’ equity 93,690 84,624 79,976 76,892 69,139
Finance debt due after more than one year 15,651 11,086 10,230 12,907 12,869
Net debt to net debt plus equity 23% 20% 17% 22% 22%
aExcludes Innovene, which was treated as a discontinued operation in accordance with IFRS 5 ‘Non-current Assets Held for Sale and Discontinued Operations’.
(See Financial statements – Note 3 on page 110.)
b2007 included $1,132 million for the acquisition of Chevron’s Netherlands manufacturing company. There were no significant acquisitions in 2006 or in 2005. Capital
expenditure in 2006 included $1 billion in respect of our investment in Rosneft. Capital expenditure and acquisitions for 2004 included $1,354 million for including TNK’s
interest in Slavneft within TNK-BP and $1,355 million for the acquisition of Solvay’s interests in BP Solvay Polyethylene Europe and BP Solvay Polyethylene North America.
Capital expenditure and acquisitions for 2003 included $5,794 million for the acquisition of our interest in TNK-BP. With the exception of the shares issued to Alfa Group and
Access Renova (AAR) in connection with TNK-BP (2004-2006), all capital expenditure and acquisitions during the past five years have been financed from cash flow from
operations, disposal proceeds and external financing.
cThe number of ordinary shares shown has been used to calculate per share amounts.
BP ANNUAL REPORT AND ACCOUNTS 2007 7