BP 2009 Annual Report Download - page 14
Download and view the complete annual report
Please find page 14 of the 2009 BP annual report below. You can navigate through the pages in the report by either clicking on the pages listed below, or by using the keyword search tool below to find specific information within the annual report.-
 1
1 -
2
-
3
-
 4
4 -
 5
5 -
 6
6 -
 7
7 -
 8
8 -
 9
9 -
 10
10 -
 11
11 -
 12
12 -
 13
13 -
 14
14 -
 15
15 -
 16
16 -
 17
17 -
 18
18 -
 19
19 -
 20
20 -
 21
21 -
 22
22 -
 23
23 -
 24
24 -
25
-
26
-
27
-
28
-
29
-
30
-
31
-
32
-
33
-
34
-
35
-
36
-
37
-
38
-
39
-
40
-
41
-
42
-
43
-
44
-
45
-
46
-
47
-
48
-
49
-
50
-
51
-
52
-
53
-
54
-
55
-
56
-
57
-
58
-
59
-
60
-
61
-
62
-
63
-
64
-
65
-
66
-
67
-
68
-
69
-
70
-
71
-
72
-
73
-
74
-
75
-
76
-
77
-
78
-
79
-
80
-
81
-
82
-
83
-
84
-
85
-
86
-
87
-
88
-
89
-
90
-
91
-
92
-
93
-
94
-
95
-
96
-
97
-
98
-
99
-
100
-
101
-
102
-
103
-
104
-
105
-
106
-
107
-
108
-
109
-
110
-
111
-
112
-
113
-
114
-
115
-
116
-
117
-
118
-
119
-
120
-
121
-
122
-
123
-
124
-
125
-
126
-
127
-
128
-
129
-
130
-
131
-
132
-
133
-
134
-
135
-
136
-
137
-
138
-
139
-
140
-
141
-
142
-
143
-
144
-
145
-
146
-
147
-
148
-
149
-
150
-
151
-
152
-
153
-
154
-
155
-
156
-
157
-
158
-
159
-
160
-
161
-
162
-
163
-
164
-
165
-
166
-
167
-
168
-
169
-
170
-
171
-
172
-
173
-
174
-
175
-
176
-
177
-
178
-
179
-
180
-
181
-
182
-
183
-
184
-
185
-
186
-
187
-
188
-
189
-
190
-
191
-
192
-
193
-
194
-
195
-
196
-
197
-
198
-
199
-
200
-
201
-
202
-
203
-
204
-
205
-
206
-
207
-
208
-
209
-
210
-
211
-
212
 |
 |

12
BP Annual Report and Accounts 2009
Business review
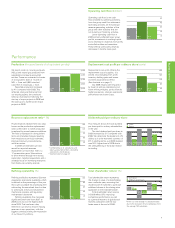
Crude oil and gas prices, and refining margins
($ per barrel of oil equivalent)
Dated Brent oil price 150
Henry Hub gas price (First of Month Index)
Global indicator refining margin (GIM)a
120
90
60
30
2004 2005 2006 2007 2008 2009
Source: Platts/BP.
Crude oil prices
Dated Brent for the year averaged $61.67 per barrel, about 37% below
2008’s record average of $97.26 per barrel. Prices began the year at their
lowest point as the world economy grappled with the sharpest downturn
in modern economic history.
Global oil consumption reflected the economic slowdown, falling
by roughly 1.3 million b/d for the year (1.5%)b, the largest annual decline
since 1982. The biggest reductions were early in the year, with OECD
countries accounting for the entire global decline. Crude oil prices rose
sharply in the second quarter in response to sustained OPEC production
cuts and emerging signs of stabilization in the world economy, despite
very high commercial oil inventories in the OECD. OPEC members
sustained roughly 2.5 million b/d of production cutsbimplemented in late
2008 and throughout 2009. Additional price increases later in the year
were sustained by further positive economic news and signs that the
inventory overhang was beginning to correct.
In 2008, the average dated Brent price of $97.26 per barrel was
34% higher than the $72.39 per barrel average seen in 2007. Daily prices
began 2008 at $96.02 per barrel, peaked at $144.22 per barrel on 3 July
2008, and fell to $36.55 per barrel at the end of the year. The sharp drop
in prices was due to falling demand in the second half of the year, caused
by the OECD falling into recession and the lagged effect on demand of
high prices in the first half of the year. OPEC had increased production
significantly through the first three quarters and, as a result of falling
consumption and rising OPEC production, inventories rose. As prices
continued to decline, OPEC responded with successive announcements
of production cuts in September, October and December.
Looking ahead, in 2010 we expect oil price movements to
continue to be driven by the extent of global economic growth and its
resulting implications for oil consumption, and by OPEC production
decisions.
aSee footnote d on page 37.
bAdapted from Oil Market Report (February 2009). ©OECD/IEA 2009.
Natural gas prices
Natural gas prices weakened in 2009 and were volatile. The average US
Henry Hub First of Month Index fell to $3.99/mmBtu in 2009, a 56%
decrease from the record $9.04/mmBtu average seen in 2008.
Recession-induced demand declines and strong production caused prices
to drop from $6.16/mmBtu at the start of the year to $2.84/mmBtu in
September. However, over the course of the year, the impact was partly
offset as US regional gas price differentials narrowed, driven partly by the
Rockies Express Pipeline extension allowing the transportation of larger
quantities of gas out of the Rockies area. Reduced imports from Canada,
slowing US production growth and cooler temperatures allowed prices to
recover to $4.49/mmBtu by the end of the year. Prices at the UK National
Balancing Point similarly fell to an average of 30.85 pence per therm,
47% below the 2008 average price of 58.12 pence per therm. In 2009,
there was a switch of uncontracted LNG cargoes from Asia to Europe,
reflecting a shift in relative spot prices. LNG imports to Europe have
competed with pipeline imports, where the gas price is often indexed to
oil prices, as well as with marginal European gas production. Gas prices
were often at or below parity with coal, when translated into the cost of
generating power, which led to gas displacing coal in power generation in
Europe and the US.
In 2008, average natural gas prices in the US and the UK were
higher than in 2007. The Henry Hub First of Month Index, at
$9.04/mmBtu, was 32% higher than the 2007 average of $6.86/mmBtu.
2008’s prices peaked at $13.11/mmBtu in July amid robust demand and
falling US gas imports, but fell to $6.90/mmBtu in December as demand
weakened and production remained strong. In the UK, 2008 average
prices of 58.12 pence per therm at the National Balancing Point, were
94% above the 2007 average of 29.95 pence per therm.
Looking ahead, gas markets in 2010 are expected to follow
developments in the global economy, but any price movements are likely
to be impacted by significant new LNG capacity as it becomes available.
Refining margins
Refining margins fell sharply in 2009 as demand for oil products reduced
in the wake of the global economic recession and new refining capacity
came onstream, mostly in Asia Pacific. The BP global indicator refining
margin (GIM)aaveraged $4 per barrel last year, down $2.50 per barrel
compared with 2008. Margins in the Far East were particularly badly hit –
averaging close to zero in Singapore – because new refining capacity has
been added in the region.
Margins in Europe were about half the 2008 level as the reduction
in economic activity meant weaker demand for commercial transport
and therefore lower middle distillate consumption. In the US, where
refining is more highly upgraded and the transport market more
gasoline-orientated, margins were stronger than in Europe.
Refining margins in 2008 were lower than in 2007, with the BP
GIM decreasing to an average of $6.50 per barrel from $9.94 per barrel in
2007. The premium for light products above fuel oils remained high,
reflecting a continuing shortage of upgrading capacity and the favouring
of fully upgraded refineries over less complex sites.
Looking ahead, refining margins are likely to remain under
pressure through 2010, with capacity already exceeding demand and
additional new capacity expected to come onstream during the year.