BP 2013 Annual Report Download - page 19
Download and view the complete annual report
Please find page 19 of the 2013 BP annual report below. You can navigate through the pages in the report by either clicking on the pages listed below, or by using the keyword search tool below to find specific information within the annual report.-
 1
1 -
2
-
3
-
4
-
5
-
6
-
7
-
8
-
 9
9 -
 10
10 -
 11
11 -
 12
12 -
 13
13 -
 14
14 -
 15
15 -
 16
16 -
 17
17 -
 18
18 -
 19
19 -
 20
20 -
 21
21 -
 22
22 -
 23
23 -
 24
24 -
 25
25 -
 26
26 -
 27
27 -
 28
28 -
 29
29 -
30
-
31
-
32
-
33
-
34
-
35
-
36
-
37
-
38
-
39
-
40
-
41
-
42
-
43
-
44
-
45
-
46
-
47
-
48
-
49
-
50
-
51
-
52
-
53
-
54
-
55
-
56
-
57
-
58
-
59
-
60
-
61
-
62
-
63
-
64
-
65
-
66
-
67
-
68
-
69
-
70
-
71
-
72
-
73
-
74
-
75
-
76
-
77
-
78
-
79
-
80
-
81
-
82
-
83
-
84
-
85
-
86
-
87
-
88
-
89
-
90
-
91
-
92
-
93
-
94
-
95
-
96
-
97
-
98
-
99
-
100
-
101
-
102
-
103
-
104
-
105
-
106
-
107
-
108
-
109
-
110
-
111
-
112
-
113
-
114
-
115
-
116
-
117
-
118
-
119
-
120
-
121
-
122
-
123
-
124
-
125
-
126
-
127
-
128
-
129
-
130
-
131
-
132
-
133
-
134
-
135
-
136
-
137
-
138
-
139
-
140
-
141
-
142
-
143
-
144
-
145
-
146
-
147
-
148
-
149
-
150
-
151
-
152
-
153
-
154
-
155
-
156
-
157
-
158
-
159
-
160
-
161
-
162
-
163
-
164
-
165
-
166
-
167
-
168
-
169
-
170
-
171
-
172
-
173
-
174
-
175
-
176
-
177
-
178
-
179
-
180
-
181
-
182
-
183
-
184
-
185
-
186
-
187
-
188
-
189
-
190
-
191
-
192
-
193
-
194
-
195
-
196
-
197
-
198
-
199
-
200
-
201
-
202
-
203
-
204
-
205
-
206
-
207
-
208
-
209
-
210
-
211
-
212
-
213
-
214
-
215
-
216
-
217
-
218
-
219
-
220
-
221
-
222
-
223
-
224
-
225
-
226
-
227
-
228
-
229
-
230
-
231
-
232
-
233
-
234
-
235
-
236
-
237
-
238
-
239
-
240
-
241
-
242
-
243
-
244
-
245
-
246
-
247
-
248
-
249
-
250
-
251
-
252
-
253
-
254
-
255
-
256
-
257
-
258
-
259
-
260
-
261
-
262
-
263
-
264
-
265
-
266
-
267
-
268
-
269
-
270
-
271
-
272
-
273
-
274
-
275
-
276
-
277
-
278
-
279
-
280
-
281
-
282
-
283
-
284
-
285
-
286
-
287
-
288
 |
 |

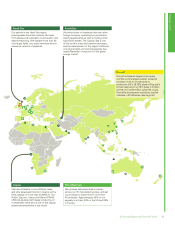
Strategic report
How we deliver Our KPIs Strategy in action in 2013
Creating shareholder value by generating
sustainable free cash flow
Recordable injury
frequency, loss of primary
containment, greenhouse
gas emissions, tier 1
process safety events.
Reserves
replacement ratio.b
Operating cash flow,
gearinga, total shareholder
return, replacement
cost profit (loss) per
ordinary share.
Production.c
Major project delivery.
Refining availability.
We seek efficient ways to deliver projects on
time and on budget, from planning through to
day-to-day operations. Our wide-ranging project
experience makes us a valued partner and
enhances our ability to compete.
We benefit from our high-performing fuels,
lubricants, petrochemicals and biofuels
businesses. Through premium products,
powerful brands and supply and trading,
Downstream provides strong cash
generation for the group.
31
fewer reported losses
of primary containment
than 2012.
129%
reserves
replacement ratio.
$21.1bn
operating cash flow.
3.2
million barrels of oil
equivalent per day.
4
major project start-ups
in Upstream and
Downstream.
95.3%
refining availability.
We prioritize the safety and reliability of our
operations to protect the welfare of our
workforce and the environment. This also helps
preserve value and secure our right to operate
around the world.
We target basins and prospects with the
greatest potential to create value, using our
leading subsurface capabilities. This allows
us to build a strong pipeline of future
growth opportunities.
We rigorously screen our investments and we work
to keep our annual capital expenditure within a set
range. Ongoing management of our portfolio helps
ensure focus on more value-driven propositions.
We balance funds between shareholder
distributions and investment for the future.
We are strengthening our portfolio of high
return and longer life assets – across deep
water, giant fields and gas value chains – to
provide BP with momentum for decades
to come.
A commitment to
safe operations
Toledo refinery sets
a safety record.
See page 42.
Maximizing value
at Mad Dog
Changing plans to make
the best financial choices.
See page 29.
Increasing oil production
in Azerbaijan
Local construction of BP’s
heaviest platform in the
Caspian Sea.
See page 48.
Discovering gas in India
Two significant discoveries
with Reliance Industries.
See page 30.
Preparing for Shah Deniz
Stage 2
Largest gas sales contracts
in Azerbaijan’s history.
See page 27.
Creating our North American
advantaged refinery
Modernization project
improves utilization and
margin capture at Whiting.
See page 33.
Proven expertise
We attract and develop the talented people
required to drive our business forward.
They apply their diverse skills and expertise
to deliver complex projects across all areas
of our business.
Strong relationships
We form enduring partnerships in the
countries in which we operate, building strong
relationships with governments, customers,
partners such as Rosneft, suppliers and
communities to create mutual advantage.
Co-operation helps unlock resources found in
challenging locations and transforms them into
products for our customers.
Advanced technology
We develop and deploy technologies
we expect to make the greatest impact on
our businesses – from enhancing the safety
and reliability of our operations to creating
competitive advantage in energy discovery,
recovery, efficiency and products.
BP Annual Report and Form 20-F 2013 15