BP 2015 Annual Report Download - page 8
Download and view the complete annual report
Please find page 8 of the 2015 BP annual report below. You can navigate through the pages in the report by either clicking on the pages listed below, or by using the keyword search tool below to find specific information within the annual report.-
 1
1 -
 2
2 -
 3
3 -
 4
4 -
 5
5 -
 6
6 -
 7
7 -
 8
8 -
 9
9 -
 10
10 -
 11
11 -
 12
12 -
 13
13 -
 14
14 -
 15
15 -
 16
16 -
 17
17 -
 18
18 -
 19
19 -
20
-
21
-
22
-
23
-
24
-
25
-
26
-
27
-
28
-
29
-
30
-
31
-
32
-
33
-
34
-
35
-
36
-
37
-
38
-
39
-
40
-
41
-
42
-
43
-
44
-
45
-
46
-
47
-
48
-
49
-
50
-
51
-
52
-
53
-
54
-
55
-
56
-
57
-
58
-
59
-
60
-
61
-
62
-
63
-
64
-
65
-
66
-
67
-
68
-
69
-
70
-
71
-
72
-
73
-
74
-
75
-
76
-
77
-
78
-
79
-
80
-
81
-
82
-
83
-
84
-
85
-
86
-
87
-
88
-
89
-
90
-
91
-
92
-
93
-
94
-
95
-
96
-
97
-
98
-
99
-
100
-
101
-
102
-
103
-
104
-
105
-
106
-
107
-
108
-
109
-
110
-
111
-
112
-
113
-
114
-
115
-
116
-
117
-
118
-
119
-
120
-
121
-
122
-
123
-
124
-
125
-
126
-
127
-
128
-
129
-
130
-
131
-
132
-
133
-
134
-
135
-
136
-
137
-
138
-
139
-
140
-
141
-
142
-
143
-
144
-
145
-
146
-
147
-
148
-
149
-
150
-
151
-
152
-
153
-
154
-
155
-
156
-
157
-
158
-
159
-
160
-
161
-
162
-
163
-
164
-
165
-
166
-
167
-
168
-
169
-
170
-
171
-
172
-
173
-
174
-
175
-
176
-
177
-
178
-
179
-
180
-
181
-
182
-
183
-
184
-
185
-
186
-
187
-
188
-
189
-
190
-
191
-
192
-
193
-
194
-
195
-
196
-
197
-
198
-
199
-
200
-
201
-
202
-
203
-
204
-
205
-
206
-
207
-
208
-
209
-
210
-
211
-
212
-
213
-
214
-
215
-
216
-
217
-
218
-
219
-
220
-
221
-
222
-
223
-
224
-
225
-
226
-
227
-
228
-
229
-
230
-
231
-
232
-
233
-
234
-
235
-
236
-
237
-
238
-
239
-
240
-
241
-
242
-
243
-
244
-
245
-
246
-
247
-
248
-
249
-
250
-
251
-
252
-
253
-
254
-
255
-
256
-
257
-
258
-
259
-
260
-
261
-
262
-
263
-
264
-
265
-
266
 |
 |

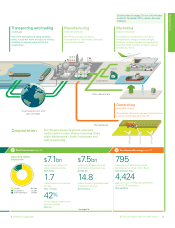
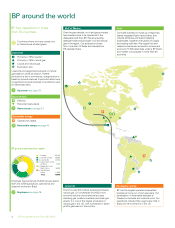
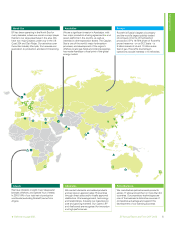
Our fuels business is made up of regionally
based integrated fuels value chains, that
include refineries and fuels marketing
businesses, together with global oil supply
and trading activities. We supply fuel and
related convenience services to consumers
at around 17,200 retail sites under a BP brand
and market our products in more than 50
countries.
Fuels
Countries where we have operations
or interests are shaded green.
Upstream see page 28.
BP has operations in more
than 70 countries.
Upstream
Primarily (>75%) liquids★.
Primarily (>75%) natural gas.
Liquids and natural gas.
Exploration site.
Locations are categorized as liquids or natural
gas based on 2015 production. Where
production is yet to commence, categorization is
based on proved reserves. Exploration sites have
no significant proved reserves or production as at
31 December 2015.
BP around the world
Downstream
Refinery.
Petrochemicals site(s).
Downstream see page 34.
The US Lower 48 onshore business produces
natural gas, oil, condensate and NGLs from
conventional and unconventional sources
including gas, coalbed methane and shale gas
assets. It is one of the largest producers of
natural gas in the US, with a presence in seven
prolific gas basins in the country.
Lower 48
1
6
2
3
4
5
1. Europe 33,100
2. US and Canada 16,600
3. Asia Pacific 14,700
4. South and Central
America 7,200
5. Middle East and
North Africa
5,900
6. Sub-Saharan
Africa 2,300
Total 79,800
BP group employees by region
Renewable energy
Operational assets.
Renewable energy see page 40.
Over the past decade, no oil and gas company
has invested more in its operations in the
deepwater Gulf than BP. We are a leading
acreage holder and producer of oil and natural
gas in the region. Our production comes
from more than 10 fields and includes four
BP-operated hubs.
Gulf of Mexico
BP has the largest operated renewables
business among our oil and gas peers. Our
participation in renewable energies is
focused on biofuels and onshore wind. Our
operations include three sugar cane mills in
Brazil and 16 wind farms in the US.
Renewable energy
Employees see page 49.
BP Annual Report and Form 20-F 20154
Employee figures include 15,600 service station
staff and 4,800 agricultural, operational and
seasonal workers in Brazil.