Berkshire Hathaway 2010 Annual Report Download - page 14
Download and view the complete annual report
Please find page 14 of the 2010 Berkshire Hathaway annual report below. You can navigate through the pages in the report by either clicking on the pages listed below, or by using the keyword search tool below to find specific information within the annual report.-
 1
1 -
2
-
3
-
 4
4 -
 5
5 -
 6
6 -
 7
7 -
 8
8 -
 9
9 -
 10
10 -
 11
11 -
 12
12 -
 13
13 -
 14
14 -
 15
15 -
 16
16 -
 17
17 -
 18
18 -
 19
19 -
 20
20 -
 21
21 -
 22
22 -
 23
23 -
 24
24 -
25
-
26
-
27
-
28
-
29
-
30
-
31
-
32
-
33
-
34
-
35
-
36
-
37
-
38
-
39
-
40
-
41
-
42
-
43
-
44
-
45
-
46
-
47
-
48
-
49
-
50
-
51
-
52
-
53
-
54
-
55
-
56
-
57
-
58
-
59
-
60
-
61
-
62
-
63
-
64
-
65
-
66
-
67
-
68
-
69
-
70
-
71
-
72
-
73
-
74
-
75
-
76
-
77
-
78
-
79
-
80
-
81
-
82
-
83
-
84
-
85
-
86
-
87
-
88
-
89
-
90
-
91
-
92
-
93
-
94
-
95
-
96
-
97
-
98
-
99
-
100
-
101
-
102
-
103
-
104
-
105
-
106
-
107
-
108
-
109
-
110
 |
 |

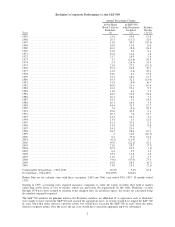
Manufacturing, Service and Retailing Operations
Our activities in this part of Berkshire cover the waterfront. Let’s look, though, at a summary balance
sheet and earnings statement for the entire group.
Balance Sheet 12/31/10 (in millions)
Assets
Cash and equivalents ................. $ 2,673
Accounts and notes receivable .......... 5,396
Inventory .......................... 7,101
Other current assets .................. 550
Total current assets ................... 15,720
Goodwill and other intangibles ......... 16,976
Fixed assets ........................ 15,421
Other assets ........................ 3,029
$51,146
Liabilities and Equity
Notes payable ....................... $ 1,805
Other current liabilities ............... 8,169
Total current liabilities ................ 9,974
Deferred taxes ...................... 3,001
Term debt and other liabilities .......... 6,621
Equity ............................. 31,550
$51,146
Earnings Statement (in millions)
2010 2009 2008
Revenues ......................................................... $66,610 $61,665 $66,099
Operating expenses (including depreciation of $1,362 in 2010, $1,422 in 2009
and $1,280 in 2008) ............................................... 62,225 59,509 61,937
Interest expense .................................................... 111 98 139
Pre-tax earnings .................................................... 4,274* 2,058* 4,023*
Income taxes and non-controlling interests ............................... 1,812 945 1,740
Net earnings ....................................................... $ 2,462 $ 1,113 $ 2,283
*Does not include purchase-accounting adjustments.
This group of companies sells products ranging from lollipops to jet airplanes. Some of the businesses
enjoy terrific economics, measured by earnings on unleveraged net tangible assets that run from 25% after-tax to
more than 100%. Others produce good returns in the area of 12-20%. Unfortunately, a few have very poor
returns, a result of some serious mistakes I have made in my job of capital allocation. These errors came about
because I misjudged either the competitive strength of the business I was purchasing or the future economics of
the industry in which it operated. I try to look out ten or twenty years when making an acquisition, but sometimes
my eyesight has been poor.
Most of the companies in this section improved their earnings last year and four set records. Let’s look
first at the record-breakers.
• TTI, our electronic components distributor, had sales 21% above its previous high (recorded in 2008)
and pre-tax earnings that topped its earlier record by 58%. Its sales gains spanned three continents, with
North America at 16%, Europe at 26%, and Asia at 50%. The thousands of items TTI distributes are
pedestrian, many selling for less than a dollar. The magic of TTI’s exceptional performance is created
by Paul Andrews, its CEO, and his associates.
12