Best Buy 2016 Annual Report Download - page 4
Download and view the complete annual report
Please find page 4 of the 2016 Best Buy annual report below. You can navigate through the pages in the report by either clicking on the pages listed below, or by using the keyword search tool below to find specific information within the annual report.-
 1
1 -
 2
2 -
 3
3 -
 4
4 -
 5
5 -
 6
6 -
 7
7 -
 8
8 -
 9
9 -
 10
10 -
 11
11 -
 12
12 -
 13
13 -
 14
14 -
 15
15 -
16
-
17
-
18
-
19
-
20
-
21
-
22
-
23
-
24
-
25
-
26
-
27
-
28
-
29
-
30
-
31
-
32
-
33
-
34
-
35
-
36
-
37
-
38
-
39
-
40
-
41
-
42
-
43
-
44
-
45
-
46
-
47
-
48
-
49
-
50
-
51
-
52
-
53
-
54
-
55
-
56
-
57
-
58
-
59
-
60
-
61
-
62
-
63
-
64
-
65
-
66
-
67
-
68
-
69
-
70
-
71
-
72
-
73
-
74
-
75
-
76
-
77
-
78
-
79
-
80
-
81
-
82
-
83
-
84
-
85
-
86
-
87
-
88
-
89
-
90
-
91
-
92
-
93
-
94
-
95
-
96
-
97
-
98
-
99
-
100
-
101
-
102
-
103
-
104
-
105
-
106
-
107
-
108
-
109
-
110
-
111
-
112
-
113
-
114
-
115
-
116
 |
 |
We have also meaningfully enhanced the customer experience in our stores and around
the services we provide to our customers, from consultation to installation, setup, support
and repair.
All of this progress has allowed us to gain market share in nearly all of our traditional
consumer electronics (“CE”) categories, as well as appliances.
None of this would have been possible without the talent and engagement of our
leaders and employees. I am proud of what they do everyday and thank each individual
member of our team for what they have done to bring us here.
Engagement scores have drastically improved since the outset of our transformation.
This year, we also saw a decrease in employee turnover in our stores, allowing us to
better serve our customers. We have invested in the training and daily coaching of our
front-line employees to be able to deliver enhanced levels of proficiency. We have also
enhanced our capabilities in several areas that are critical to our future, including digital
and mobile.
We have continued to strengthen our collaboration with key vendor partners. For
instance, we now have 630 Samsung and 380 Sony home theater stores-within-a-store;
225 Samsung Open House appliance experiences; 814 Windows stores; and 249 AT&T
and Verizon mobile shops within our big box stores. This collaboration with key vendors
is one of the ways we showcase for our customers the latest and greatest technology in a
tangible fashion. A great example of this is the work we have done with key vendors to
introduce 4K TV technology to a broad consumer base, increasing adoption at a strong
rate.
From an economic standpoint, in FY16 we were able to deliver $150 million against our
$400 million cost reduction and gross profit optimization goal. This was in addition to the
$1 billion in costs we removed from our business in the past few years.
We were also able to successfully consolidate our two Canadian brands and embark on a
significant transformation in Canada. Customer retention in Canada is better than
expected, and it is clear that we made the correct decision in moving to a single brand,
Best Buy.
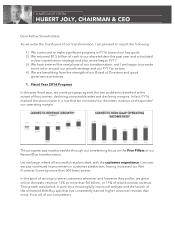
In aggregate, our decision to focus on North America and the improvements we’ve made
in our business have resulted in a significant increase in our non-GAAP return on invested
capital (“ROIC”) from 9.2% in FY12 to 13.6% in FY16.*
Finally, throughout FY16 we continued to seek to positively impact the world. Our
recycling efforts have collected more than 1 billion pounds of e-waste, and our pledge to
reduce our carbon footprint by 20% was met in FY16. We subsequently increased our
target to a 40% reduction by calendar year 2020 from a 2009 baseline. Our Best Buy
Foundation continued its work to provide underserved teenagers across the U.S. with
access to technology. We increased the number of our Teen Tech Centers and Geek