Big Lots 2015 Annual Report Download - page 108
Download and view the complete annual report
Please find page 108 of the 2015 Big Lots annual report below. You can navigate through the pages in the report by either clicking on the pages listed below, or by using the keyword search tool below to find specific information within the annual report.-
 1
1 -
2
-
3
-
4
-
5
-
6
-
7
-
8
-
9
-
10
-
11
-
12
-
13
-
14
-
15
-
16
-
17
-
18
-
19
-
20
-
21
-
22
-
23
-
24
-
25
-
26
-
27
-
28
-
29
-
30
-
31
-
32
-
33
-
34
-
35
-
36
-
37
-
38
-
39
-
40
-
41
-
42
-
43
-
44
-
45
-
46
-
47
-
48
-
49
-
50
-
51
-
52
-
53
-
54
-
55
-
56
-
57
-
58
-
59
-
60
-
61
-
62
-
63
-
64
-
65
-
66
-
67
-
68
-
69
-
70
-
71
-
72
-
73
-
74
-
75
-
76
-
77
-
78
-
79
-
80
-
81
-
82
-
83
-
84
-
85
-
86
-
87
-
88
-
89
-
90
-
91
-
92
-
93
-
94
-
95
-
96
-
97
-
 98
98 -
 99
99 -
 100
100 -
 101
101 -
 102
102 -
 103
103 -
 104
104 -
 105
105 -
 106
106 -
 107
107 -
 108
108 -
 109
109 -
 110
110 -
 111
111 -
 112
112 -
 113
113 -
 114
114 -
 115
115 -
 116
116 -
 117
117 -
 118
118 -
119
-
120
-
121
-
122
-
123
-
124
-
125
-
126
-
127
-
128
-
129
-
130
-
131
-
132
-
133
-
134
-
135
-
136
-
137
-
138
-
139
-
140
-
141
-
142
-
143
-
144
-
145
-
146
-
147
-
148
-
149
-
150
-
151
-
152
-
153
-
154
-
155
-
156
-
157
-
158
-
159
-
160
-
161
-
162
-
163
-
164
-
165
-
166
 |
 |

31
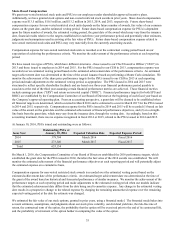
In June 2014, we announced that our Board of Directors commenced a cash dividend program and we declared and paid three
quarterly cash dividends of $0.17 per common share for a total paid amount of approximately $27.8 million during 2014. In
2015, we declared and paid four quarterly cash dividends of $0.19 per common share for a total paid amount of approximately
$38.5 million.
In March 2016, our Board increased our quarterly dividend payment rate by approximately 11% by declaring a quarterly cash
dividend of $0.21 per common share payable on April 1, 2016 to shareholders of record as of the close of business on March
18, 2016.
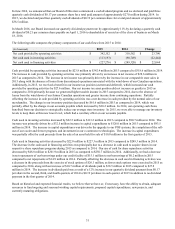
The following table compares the primary components of our cash flows from 2015 to 2014:
(in thousands) 2015 2014 Change
Net cash provided by operating activities $ 342,352 $ 318,562 $ 23,790
Net cash used in investing activities (113,193)(90,749)(22,444)
Net cash used in financing activities $ (227,276)$ (249,320) $ 22,044
Cash provided by operating activities increased by $23.8 million to $342.4 million in 2015 compared to $318.6 million in 2014.
The increase in cash provided by operating activities was primarily driven by an increase in net income of $28.6 million in
2015 as compared to 2014. The increase in net income was primarily driven by the increase in our comparable store sales in
2015 along with the absence of losses from discontinued operations associated with the wind down of our Canadian operations.
Additionally, in 2015, we received a benefit in our income tax position (current and deferred), which increased our cash
provided by operating activities by $27.6 million. Our net income tax asset position did not increase as greatly in 2015 as
compared to 2014 primarily because we generated higher taxable income in 2015 compared to 2014, due to the absence of
losses from the wind down of our former Canadian operations and greater income from continuing operations. Partially
offsetting the increase in cash provided by operating activities was a net decrease in cash provided by the normal sales of our
merchandise. The change in our inventory position decreased by $61.6 million in 2015 as compared to 2014, which was
partially offset by the change in our accounts payable which increased by $30.2 million. In 2014, our operating cash flows
benefited from our decision to strategically reduce our average store inventory. In 2015, we were able to manage our inventory
levels to keep them at this new lower level, which had a corollary effect on our accounts payable.
Cash used in investing activities increased by $22.5 million to $113.2 million in 2015 compared to $90.7 million in 2014. The
increase was primarily driven by a $32.5 million increase in capital expenditures to $126.0 million in 2015 compared to $93.5
million in 2014. The increase in capital expenditures was driven by the upgrade to our POS systems, the completion of the roll-
out of our cooler and freezer program, and investment in our e-commerce technologies. The increase in capital expenditures
was partially offset by cash proceeds from the sale of an asset held for sale of $10.0 million in the first quarter of 2015.
Cash used in financing activities decreased by $22.0 million to $227.3 million in 2015 compared to $249.3 million in 2014.
The decrease in the cash used in financing activities was principally due to a decrease in cash used to acquire shares in our
respective share repurchase programs during 2015 as compared to 2014. Our use of cash for share repurchase activities
decreased by $48.8 million to $201.9 million in 2015 as compared to $250.7 million in 2014. Additionally, we had a decrease
in net repayments of our borrowings under our credit facility of $15.1 million to net borrowings of $0.2 million in 2015
compared to net repayments of $14.9 million in 2014. Partially offsetting the decrease in cash used in financing activities was
a decrease in the proceeds from the exercise of stock options of $26.3 million, as fewer stock options were exercised in 2015 as
compared to 2014, along with an increase of $10.7 million of dividends paid to $38.5 million in 2015 compared to $27.8
million in 2014. The increase in dividends paid was a result of a 12% increase in our quarterly dividend payment from $0.17
per share in the second, third, and fourth quarters of 2014 to $0.19 per share in each quarter of 2015 in addition to no dividend
payment in the first quarter of 2014.
Based on historical and expected financial results, we believe that we have or, if necessary, have the ability to obtain, adequate
resources to fund ongoing and seasonal working capital requirements, proposed capital expenditures, new projects, and
currently maturing obligations.