Cabela's 2012 Annual Report Download - page 102
Download and view the complete annual report
Please find page 102 of the 2012 Cabela's annual report below. You can navigate through the pages in the report by either clicking on the pages listed below, or by using the keyword search tool below to find specific information within the annual report.-
 1
1 -
2
-
3
-
4
-
5
-
6
-
7
-
8
-
9
-
10
-
11
-
12
-
13
-
14
-
15
-
16
-
17
-
18
-
19
-
20
-
21
-
22
-
23
-
24
-
25
-
26
-
27
-
28
-
29
-
30
-
31
-
32
-
33
-
34
-
35
-
36
-
37
-
38
-
39
-
40
-
41
-
42
-
43
-
44
-
45
-
46
-
47
-
48
-
49
-
50
-
51
-
52
-
53
-
54
-
55
-
56
-
57
-
58
-
59
-
60
-
61
-
62
-
63
-
64
-
65
-
66
-
67
-
68
-
69
-
70
-
71
-
72
-
73
-
74
-
75
-
76
-
77
-
78
-
79
-
80
-
81
-
82
-
83
-
84
-
85
-
86
-
87
-
88
-
89
-
90
-
91
-
 92
92 -
 93
93 -
 94
94 -
 95
95 -
 96
96 -
 97
97 -
 98
98 -
 99
99 -
 100
100 -
 101
101 -
 102
102 -
 103
103 -
 104
104 -
 105
105 -
 106
106 -
 107
107 -
 108
108 -
 109
109 -
 110
110 -
 111
111 -
 112
112 -
113
-
114
-
115
-
116
-
117
-
118
-
119
-
120
-
121
-
122
-
123
-
124
-
125
-
126
-
127
-
128
-
129
-
130
-
131
-
132
-
133
-
134
-
135
 |
 |

92
CABELA’S INCORPORATED AND SUBSIDIARIES
NOTES TO CONSOLIDATED FINANCIAL STATEMENTS
(Dollars in Thousands Except Share and Per Share Amounts)
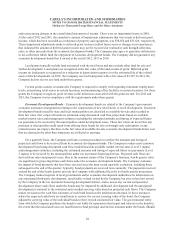
1 1. TIME DEPOSITS
The Financial Services segment accepts time deposits only in amounts of at least one hundred thousand
dollars. All time deposits are interest bearing. The aggregate amount of time deposits, net of brokered fees, by
maturity at the end of 2012 was as follows:
2013 $ 367,350
2014 297,628
2015 199,314
2016 152,078
2017 26,164
Thereafter 5,484
1,048,018
Less current maturities (367,350)
Deposits classified as non-current liabilities $ 680,668
Time deposits include brokered institutional certificates of deposit totaling $1,032,817 and $963,909 at the end
of 2012 and 2011, respectively.
12. BORROWINGS OF FINANCIAL SERVICES SEGMENT
The obligations of the Trust are secured borrowings backed by restricted credit card loans. The following
table presents, as of December 29, 2012, and December 31, 2011, a summary of the secured fixed and variable rate
long-term obligations of the Trust, the expected maturity dates, and the respective weighted average interest rates.
At December 29, 2012:
Series
Expected
Maturity
Date
Fixed Rate
Obligations
Interest
Rate
Var iable R ate
Obligations
Interest
Rate
Tota l
Obligations
Interest
Rate
Series 2010-I January 2015 $ - -% $ 255,000 1.66% $ 255,000 1.66%
Series 2010-II September 2015 127,500 2.29 85,000 0.91 212,500 1.74
Series 2011-II June 2016 155,000 2.39 100,000 0.81 255,000 1.77
Series 2011-IV October 2016 165,000 1.90 90,000 0.76 255,000 1.50
Series 2012-I February 2017 275,000 1.63 150,000 0.74 425,000 1.32
Series 2012-II June 2017 300,000 1.45 125,000 0.69 425,000 1.23
Total secured obligations 1,022,500 805,000 1,827,500
Less: current maturities - - -
Secured long-term
obligations of the Trust,
less current maturities $ 1,022,500 $ 805,000 $ 1,827,500