DIRECTV 2011 Annual Report Download - page 67
Download and view the complete annual report
Please find page 67 of the 2011 DIRECTV annual report below. You can navigate through the pages in the report by either clicking on the pages listed below, or by using the keyword search tool below to find specific information within the annual report.-
 1
1 -
2
-
3
-
4
-
5
-
6
-
7
-
8
-
9
-
10
-
11
-
12
-
13
-
14
-
15
-
16
-
17
-
18
-
19
-
20
-
21
-
22
-
23
-
24
-
25
-
26
-
27
-
28
-
29
-
30
-
31
-
32
-
33
-
34
-
35
-
36
-
37
-
38
-
39
-
40
-
41
-
42
-
43
-
44
-
45
-
46
-
47
-
48
-
49
-
50
-
51
-
52
-
53
-
54
-
55
-
56
-
 57
57 -
 58
58 -
 59
59 -
 60
60 -
 61
61 -
 62
62 -
 63
63 -
 64
64 -
 65
65 -
 66
66 -
 67
67 -
 68
68 -
 69
69 -
 70
70 -
 71
71 -
 72
72 -
 73
73 -
 74
74 -
 75
75 -
 76
76 -
 77
77 -
78
-
79
-
80
-
81
-
82
-
83
-
84
-
85
-
86
-
87
-
88
-
89
-
90
-
91
-
92
-
93
-
94
-
95
-
96
-
97
-
98
-
99
-
100
-
101
-
102
-
103
-
104
-
105
-
106
-
107
-
108
-
109
-
110
-
111
-
112
-
113
-
114
-
115
-
116
-
117
-
118
-
119
-
120
-
121
-
122
-
123
-
124
-
125
-
126
-
127
-
128
-
129
-
130
-
131
-
132
-
133
-
134
-
135
-
136
-
137
-
138
-
139
-
140
-
141
-
142
-
143
-
144
-
145
-
146
-
147
-
148
-
149
-
150
-
151
-
152
 |
 |

DIRECTV
increases and higher penetration of advanced products across the region, as well as The increase in our total revenues was due to subscriber growth and higher
favorable exchange rates in Brazil. ARPU at DIRECTV U.S., subscriber growth at DIRECTV Latin America, as well
as the revenue generated by DIRECTV Sports Networks which we acquired in
Operating profit before depreciation and amortization. Operating profit before November 2009.
depreciation and amortization increased in 2011 as compared to 2010, primarily
due to the increased gross profit generated from the higher revenues, partially offset Operating profit before depreciation and amortization. The following table
by higher subscriber acquisition costs due to the higher number of gross subscriber presents our operating profit (loss) before depreciation and amortization by
additions, higher general and administrative costs as well as higher upgrade and segment:
retention costs resulting from the increased demand for advanced products. Change
Operating profit (loss) before depreciation and
Operating profit. Operating profit increased in 2011 as compared to 2010, amortization by segment: 2010 2009 $ %
primarily due to higher operating profit before depreciation and amortization, (Dollars in Millions)
discussed above, partially offset by higher depreciation and amortization expense DIRECTV U.S. .................... $5,216 $4,685 $ 531 11.3%
resulting from an increase in basic and advanced product receivers capitalized due to DIRECTV Latin America .............. 1,164 697 467 67.0%
the higher gross subscriber additions attained over the last year. Sports Networks, Eliminations and Other .... (2) (69) 67 NM
Total operating profit before depreciation
Sports Networks, Eliminations and Other and amortization ................. $6,378 $5,313 $1,065 20.0%
Operating profit from Sports Networks, Elimination and Other increased to Operating profit before depreciation and
$11 million in 2011 from a $17 million operating loss in 2010. amortization margin ................ 26.5% 24.6% — —
The increase in total operating profit before depreciation and amortization was
Year Ended December 31, 2010 Compared with the Year Ended December 31, due to higher gross profit from the increase in revenues, lower charges in 2010 for
2009 foreign currency transactions at DIRECTV Latin America, offset by higher
Consolidated Results of Operations subscriber acquisition costs and upgrade and retention costs at both DIRECTV U.S
and DIRECTV Latin America and higher general and administrative expenses at
We discuss changes for each of our segments in more detail below. DIRECTV U.S.
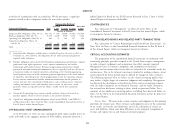
Revenues. The following table presents our revenues by segment:
Change
Revenues by segment: 2010 2009 $ %
(Dollars in Millions)
DIRECTV U.S. .................. $20,268 $18,671 $1,597 8.6%
DIRECTV Latin America ............ 3,597 2,878 719 25.0%
Sports Networks, Eliminations and Other . . 237 16 221 NM
Total Revenues .................. $24,102 $21,565 $2,537 11.8%
43