Dell 2011 Annual Report Download - page 40
Download and view the complete annual report
Please find page 40 of the 2011 Dell annual report below. You can navigate through the pages in the report by either clicking on the pages listed below, or by using the keyword search tool below to find specific information within the annual report.-
 1
1 -
2
-
3
-
4
-
5
-
6
-
7
-
8
-
9
-
10
-
11
-
12
-
13
-
14
-
15
-
16
-
17
-
18
-
19
-
20
-
21
-
22
-
23
-
24
-
25
-
26
-
27
-
28
-
29
-
 30
30 -
 31
31 -
 32
32 -
 33
33 -
 34
34 -
 35
35 -
 36
36 -
 37
37 -
 38
38 -
 39
39 -
 40
40 -
 41
41 -
 42
42 -
 43
43 -
 44
44 -
 45
45 -
 46
46 -
 47
47 -
 48
48 -
 49
49 -
 50
50 -
51
-
52
-
53
-
54
-
55
-
56
-
57
-
58
-
59
-
60
-
61
-
62
-
63
-
64
-
65
-
66
-
67
-
68
-
69
-
70
-
71
-
72
-
73
-
74
-
75
-
76
-
77
-
78
-
79
-
80
-
81
-
82
-
83
-
84
-
85
-
86
-
87
-
88
-
89
-
90
-
91
-
92
-
93
-
94
-
95
-
96
-
97
-
98
-
99
-
100
-
101
-
102
-
103
-
104
-
105
-
106
-
107
-
108
-
109
-
110
-
111
-
112
-
113
-
114
-
115
-
116
-
117
-
118
-
119
-
120
-
121
-
122
-
123
-
124
-
125
-
126
-
127
-
128
-
129
-
130
-
131
-
132
-
133
-
134
-
135
-
136
-
137
 |
 |

Table of Contents
Segment Discussion
Our four global business segments are Large Enterprise, Public, Small and Medium Business, and Consumer.
Severance and facility actions and acquisition-related charges, broad based, long-term incentive expenses, amortization of purchased intangible assets costs,
and charges related to our settlement of the SEC investigation as well as a securities litigation class action lawsuit that were incurred during Fiscal 2011, are
not allocated to the reporting segments as management does not believe that these items are reflective of the underlying operating performance of the
reporting segments. These costs totaled $1.1 billion for each of Fiscal 2012 and Fiscal 2011, and $1.2 billion for Fiscal 2010.
See Note 15 of the Notes to Consolidated Financial Statements included in “Part II — Item 8 — Financial Statements and Supplementary Data” for
additional information and reconciliation of segment revenue and operating income to consolidated revenue and operating income.
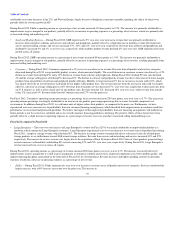
The following table presents our net revenue and operating income by our reportable global segments:
Fiscal Year Ended
February 3, 2012 January 28, 2011 January 29, 2010
Dollars % of
Revenue(a)
%
Change Dollars % of
Revenue(a)
%
Change Dollars % of
Revenue(a)
(in millions, except percentages)
Large Enterprise
Net revenue $ 18,457 30% 4 % $ 17,813 29% 25 % $ 14,285 27%
Operating income $ 1,854 10.0% 26 % $ 1,473 8.3% 80 % $ 819 5.7%
Public
Net revenue $ 16,548 27% (2)% $ 16,851 27% 16 % $ 14,484 27%
Operating income $ 1,644 9.9% 11 % $ 1,484 8.8% 9 % $ 1,361 9.4%
Small and Medium Business
Net revenue $ 15,166 24% 5 % $ 14,473 24% 20 % $ 12,079 23%
Operating income $ 1,665 11.0% 13 % $ 1,477 10.2% 42 % $ 1,040 8.6%
Consumer
Net revenue $ 11,900 19% (4)% $ 12,357 20% 3 % $ 12,054 23%
Operating income $ 324 2.7% 398 % $ 65 0.5% (39)% $ 107 0.9%
_______________________
(a) Operating income percentage of revenue is stated in relation to the respective segment.
Fiscal 2012 compared to Fiscal 2011
•Large Enterprise — During Fiscal 2012, Large Enterprise experienced a 4% year-over-year increase in revenue that was driven by increases in revenue
across all product lines, except for storage revenue and desktop PC revenue, which declined 30% and was essentially unchanged, respectively. The
decline in storage revenue was primarily due to a decrease in the sale of third-party storage products as we shifted to sales of Dell-owned storage
solutions. Revenue from services and servers and networking increased 13% and 8%, year-over-year, respectively, while mobility revenue increased 6%
and software and peripherals revenue increased 2% year-over-year. During Fiscal 2012, Large Enterprise's revenue from outside the U.S increased year-
over year, while revenue from the U.S. decreased slightly.
During Fiscal 2012, Large Enterprise's operating income as a percentage of revenue increased 170 basis points year-over-year to 10.0%. The increase was
primarily attributable to improvements in gross margin for our products, partially offset by an increase in operating expenses as a percentage of net revenue,
resulting primarily from increased selling and marketing costs.
•Public — During Fiscal 2012, Public experienced a 2% year-over-year decrease in revenue which was primarily driven by a weakened demand
environment. Revenue from desktop PCs, storage products, and mobility products decreased year-over-year by 7%, 16%, and 3%, respectively. Revenue
from services, servers and networking, and software and peripherals increased 4%, 3%, and 1% year-over-year, respectively. The decline in Public's
revenue was primarily
38