Ford 2005 Annual Report Download - page 32
Download and view the complete annual report
Please find page 32 of the 2005 Ford annual report below. You can navigate through the pages in the report by either clicking on the pages listed below, or by using the keyword search tool below to find specific information within the annual report.-
 1
1 -
2
-
3
-
4
-
5
-
6
-
7
-
8
-
9
-
10
-
11
-
12
-
13
-
14
-
15
-
16
-
17
-
18
-
19
-
20
-
21
-
 22
22 -
 23
23 -
 24
24 -
 25
25 -
 26
26 -
 27
27 -
 28
28 -
 29
29 -
 30
30 -
 31
31 -
 32
32 -
 33
33 -
 34
34 -
 35
35 -
 36
36 -
 37
37 -
 38
38 -
 39
39 -
 40
40 -
 41
41 -
 42
42 -
43
-
44
-
45
-
46
-
47
-
48
-
49
-
50
-
51
-
52
-
53
-
54
-
55
-
56
-
57
-
58
-
59
-
60
-
61
-
62
-
63
-
64
-
65
-
66
-
67
-
68
-
69
-
70
-
71
-
72
-
73
-
74
-
75
-
76
-
77
-
78
-
79
-
80
-
81
-
82
-
83
-
84
-
85
-
86
-
87
-
88
-
89
-
90
-
91
-
92
-
93
-
94
-
95
-
96
-
97
-
98
-
99
-
100
-
101
-
102
-
103
-
104
-
105
-
106
-
107
-
108
 |
 |

Management’s Discussion and Analysis of Financial
Condition and Results of Operations
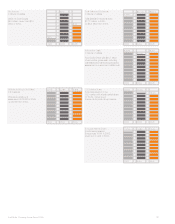
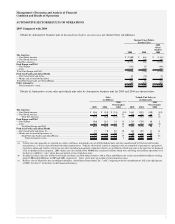
Details of Automotive sector sales and vehicle unit sales by Automotive business unit for 2004 and 2003 are shown below:
Sales
(in billions)
Vehicle Unit Sales (a)
(in thousands)
2004 2003
2004
Over/(Under)
2003 2004 2003
2004
Over/(Under)
2003
The Americas
— Ford North America................................................................
..............................
$ 83.0 $ 83.6 $ (0.6) (1)% 3,623 3,810 (187) (5)%
— Ford South America ................................................................
..............................
3.0 1.9 1.1 58 292 210 82 39
Total The Americas................................................................
...........................
86.0 85.5 0.5 1 3,915 4,020 (105) (3)
Ford Europe and PAG
— Ford Europe ................................................................................................
..........
26.5 22.2 4.3 19 1,705 1,609 96 6
— PAG ................................................................................................
......................
27.6 24.8 2.8 11 771 754 17 2
Total Ford Europe and PAG................................................................
..............
54.1 47.0 7.1 15 2,476 2,363 113 5
Ford Asia Pacific and Africa/Mazda
— Ford Asia Pacific and Africa (b) ................................................................
...........
7.0 5.8 1.2 21 407 353 54 15
— Mazda and Associated Operations ................................................................
........
———— — ———
Total Ford Asia Pacific and Africa/Mazda................................
........................
7.0 5.8 1.2 21 407 353 54 15
Other Automotive ................................................................................................
....
Total Automotive sector ................................................................
.............
$ 147.1 $ 138.3 $ 8.8 6 6,798 6,736 62 1
__________
(a) Vehicle unit sales generally are reported on a where-sold basis, and include sales of all Ford-badged units and units manufactured by Ford and sold to other
manufacturers, as well as units distributed for other manufacturers. Vehicles sold to daily rental car companies that are returned to us pursuant to a guaranteed
repurchase option and vehicles used in our own fleet (including management evaluation vehicles) are included in vehicle unit sales at the time they are disposed
of by us through used car channels.
(b) Included in vehicle unit sales of Ford Asia Pacific and Africa are Ford-badged vehicles sold in China and Malaysia by certain unconsolidated affiliates totaling
about 66,000 and 34,000 units in 2004 and 2003, respectively. "Sales" above does not include revenue from these units.
Details of Automotive sector market share for selected markets for 2004 and 2003 are shown below:
Dealer-Owned Stocks (a)
Market Share (in thousands)
Market 2004 2003
2004
Over/(Under)
2003 2004 2003
2004
Over/(Under)
2003
U.S. (b) .................................................. 18.0% 19.2% (1.2) pts. 794 791 3
Brazil (b)................................................ 11.8 11.5 0.3 19 12 7
Europe (b) (c)......................................... 8.7 8.6 0.1 356 403 (47)
PAG – U.S./Europe (c) ......................... 1.3/2.3 1.3/2.1 0/ 0.2 41/68 47/59 (6)/9
Australia (b)........................................... 14.2 13.9 0.3 19 18 1
__________
(a) Dealer-owned stocks represent our estimate of vehicles shipped to our customers (dealers) and not yet sold by the dealers to their retail customers, as well as
some vehicles reflected in our inventory.
(b) Includes only Ford and, in the United States, Lincoln and Mercury brands.
(c) European market share is based on vehicle registrations for our 19 major European markets.
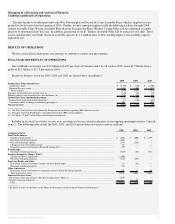
Overall Automotive Sector
The improvement in Income/(loss) before income taxes primarily reflected lower Visteon-related charges, higher net pricing,
favorable cost performance and the favorable effect of tax-related interest on refunds and settlements of prior-year federal and state
audits, offset partially by lower vehicle unit sales and unfavorable changes in currency exchange rates.
The Americas Segment
Ford North America. The improvement in earnings primarily reflected the non-recurrence of $1.6 billion of charges in 2003
related to Visteon, offset by a charge of $600 million to establish an allowance against a receivable from Visteon in 2004.
In addition, the improvement in earnings reflected positive net pricing and favorable cost performance, offset partially by lower
vehicle unit sales, unfavorable changes in currency exchange rates (primarily weakening of the U.S. dollar compared with the Euro
and the Canadian dollar) and a charge of $182 million related to our investment in Ballard Power Systems Inc., a provider of fuel-cell
technology.
Ford Motor Company Annual Report 2005 30 Ford Motor Company Annual Report 2005 31