GE 2009 Annual Report Download - page 2
Download and view the complete annual report
Please find page 2 of the 2009 GE annual report below. You can navigate through the pages in the report by either clicking on the pages listed below, or by using the keyword search tool below to find specific information within the annual report.-
 1
1 -
 2
2 -
 3
3 -
 4
4 -
 5
5 -
 6
6 -
 7
7 -
 8
8 -
 9
9 -
 10
10 -
 11
11 -
 12
12 -
 13
13 -
14
-
15
-
16
-
17
-
18
-
19
-
20
-
21
-
22
-
23
-
24
-
25
-
26
-
27
-
28
-
29
-
30
-
31
-
32
-
33
-
34
-
35
-
36
-
37
-
38
-
39
-
40
-
41
-
42
-
43
-
44
-
45
-
46
-
47
-
48
-
49
-
50
-
51
-
52
-
53
-
54
-
55
-
56
-
57
-
58
-
59
-
60
-
61
-
62
-
63
-
64
-
65
-
66
-
67
-
68
-
69
-
70
-
71
-
72
-
73
-
74
-
75
-
76
-
77
-
78
-
79
-
80
-
81
-
82
-
83
-
84
-
85
-
86
-
87
-
88
-
89
-
90
-
91
-
92
-
93
-
94
-
95
-
96
-
97
-
98
-
99
-
100
-
101
-
102
-
103
-
104
-
105
-
106
-
107
-
108
-
109
-
110
-
111
-
112
-
113
-
114
-
115
-
116
-
117
-
118
-
119
-
120
-
121
-
122
-
123
-
124
 |
 |

CONTENTS
1 Letter to Investors
10 Business Overview
24 Board of Directors
25 Financial Section
120 Corporate Information
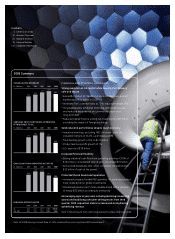
2009 Summary
financial and strategic highlights
Strong execution at GE Capital while keeping the Company
safe and secure.
• Earned $2.3 billion at Capital Finance, profitable every quarter;
earned about $11 billion in 2008 – 09
• Increased Tier 1 common ratio to 7.7%; reduced leverage 25%
• Increased liquidity; fulfilled all 2010 long-term funding needs
and reduced dependence on commercial paper and
long-term debt
• Reduced Capital Finance ending net investment by $53 billion,
excluding the impact of foreign exchange
Solid industrial performance despite tough economy.
• Industrial earnings, excluding NBC Universal, grew 1%;
industrial margins of 16.2%, up 60 basis points
• Total backlog growth of 1% to $175 billion
• Product services profit growth of 7%
• U.S. exports of $18 billion
Increased financial flexibility.
• Strong industrial cash flow from operating activities (CFOA) of
$16.6 billion; consolidated cash at year-end totaled $72 billion
• Announced divestitures that, when completed, will add another
$10 billion of cash at the parent
Protected the GE brand and reputation.
• Increased company-funded R&D spend by 7%; expanded product
lines; made dynamic global investments
• Maintained position as 4th most valuable brand with a valuation
of nearly $50 billion according to one survey
Encouraging signs at year-end, including declining nonearning
assets and stabilizing consumer delinquencies from third
quarter 2009, sequential orders increase and strengthening
advertising revenue.
Note: Financial results from continuing operations unless otherwise noted.
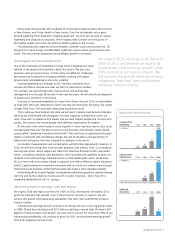
183
172
152
136
157
20062005 2007 2008 2009
CONSOLIDATED REVENUES
(In $ billions)
19.1
23.3
23.8
19.9
16.6
20062005 2007 2008 2009
CASH FLOW FROM OPERATING ACTIVITIES
(In $ billions)
18.1
22.5
19.3
17.3
11.2
20062005 2007 2008 2009
EARNINGS FROM CONTINUING OPERATIONS
ATTRIBUTABLE TO GE
(In $ billions)
(19)%12%11%GE (38)%
16%
(30)%14%10%S&P 500 16%
(7)%
20062005 2007 2008 2009
EARNINGS GROWTH RATES
Note: GE 2008 Earnings Growth Rate of -19% corrected from error in printed 2009 annual report.