HP 2008 Annual Report Download - page 143
Download and view the complete annual report
Please find page 143 of the 2008 HP annual report below. You can navigate through the pages in the report by either clicking on the pages listed below, or by using the keyword search tool below to find specific information within the annual report.-
 1
1 -
2
-
3
-
4
-
5
-
6
-
7
-
8
-
9
-
10
-
11
-
12
-
13
-
14
-
15
-
16
-
17
-
18
-
19
-
20
-
21
-
22
-
23
-
24
-
25
-
26
-
27
-
28
-
29
-
30
-
31
-
32
-
33
-
34
-
35
-
36
-
37
-
38
-
39
-
40
-
41
-
42
-
43
-
44
-
45
-
46
-
47
-
48
-
49
-
50
-
51
-
52
-
53
-
54
-
55
-
56
-
57
-
58
-
59
-
60
-
61
-
62
-
63
-
64
-
65
-
66
-
67
-
68
-
69
-
70
-
71
-
72
-
73
-
74
-
75
-
76
-
77
-
78
-
79
-
80
-
81
-
82
-
83
-
84
-
85
-
86
-
87
-
88
-
89
-
90
-
91
-
92
-
93
-
94
-
95
-
96
-
97
-
98
-
99
-
100
-
101
-
102
-
103
-
104
-
105
-
106
-
107
-
108
-
109
-
110
-
111
-
112
-
113
-
114
-
115
-
116
-
117
-
118
-
119
-
120
-
121
-
122
-
123
-
124
-
125
-
126
-
127
-
128
-
129
-
130
-
131
-
132
-
 133
133 -
 134
134 -
 135
135 -
 136
136 -
 137
137 -
 138
138 -
 139
139 -
 140
140 -
 141
141 -
 142
142 -
 143
143 -
 144
144 -
 145
145 -
 146
146 -
 147
147 -
 148
148 -
 149
149 -
 150
150 -
 151
151 -
 152
152 -
 153
153 -
154
-
155
-
156
-
157
-
158
-
159
-
160
-
161
-
162
-
163
-
164
-
165
-
166
-
167
-
168
-
169
-
170
-
171
-
172
-
173
-
174
-
175
-
176
-
177
-
178
-
179
-
180
-
181
-
182
-
183
 |
 |

HEWLETT-PACKARD COMPANY AND SUBSIDIARIES
Notes to Consolidated Financial Statements (Continued)
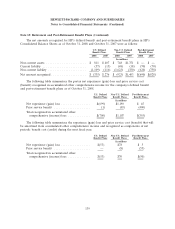
Note 15: Retirement and Post-Retirement Benefit Plans (Continued)
The weighted-average assumptions used to calculate net benefit cost were as follows for the
following fiscal years ended October 31:
U.S. Defined Non-U.S. Defined Post-Retirement
Benefit Plans Benefit Plans Benefit Plans
2008 2007 2006 2008 2007 2006 2008 2007 2006
Discount rate ........................... 6.4% 5.9% 5.9% 5.2% 4.4% 4.2% 6.2% 5.8% 5.8%
Average increase in compensation levels ....... 3.7% 4.0% 4.0% 3.3% 3.3% 3.7% — — —
Expected long-term return on assets .......... 6.7% 8.3% 8.3% 6.8% 6.7% 6.7% 8.7% 8.3% 8.3%
The 2008 weighted-average rates outlined in the table above reflect the inclusion of EDS plans
since the acquisition date.
The medical cost and related assumptions used to calculate the net post-retirement benefit cost for
the following fiscal years ended October 31 were as follows:
2008 2007 2006
Current medical cost trend rate .................................... 7.5% 8.5% 9.5%
Ultimate medical cost trend rate ................................... 5.5% 5.5% 5.5%
Year the medical cost rate reaches ultimate trend rate .................... 2010 2010 2010
A 1.0 percentage point increase in the medical cost trend rate would have increased the fiscal 2008
service and interest components of the post-retirement benefit costs by $1.7 million, while a
1.0 percentage point decrease would have resulted in a decrease of $2.0 million in the same period.
137