HP 2009 Annual Report Download - page 122
Download and view the complete annual report
Please find page 122 of the 2009 HP annual report below. You can navigate through the pages in the report by either clicking on the pages listed below, or by using the keyword search tool below to find specific information within the annual report.-
 1
1 -
2
-
3
-
4
-
5
-
6
-
7
-
8
-
9
-
10
-
11
-
12
-
13
-
14
-
15
-
16
-
17
-
18
-
19
-
20
-
21
-
22
-
23
-
24
-
25
-
26
-
27
-
28
-
29
-
30
-
31
-
32
-
33
-
34
-
35
-
36
-
37
-
38
-
39
-
40
-
41
-
42
-
43
-
44
-
45
-
46
-
47
-
48
-
49
-
50
-
51
-
52
-
53
-
54
-
55
-
56
-
57
-
58
-
59
-
60
-
61
-
62
-
63
-
64
-
65
-
66
-
67
-
68
-
69
-
70
-
71
-
72
-
73
-
74
-
75
-
76
-
77
-
78
-
79
-
80
-
81
-
82
-
83
-
84
-
85
-
86
-
87
-
88
-
89
-
90
-
91
-
92
-
93
-
94
-
95
-
96
-
97
-
98
-
99
-
100
-
101
-
102
-
103
-
104
-
105
-
106
-
107
-
108
-
109
-
110
-
111
-
 112
112 -
 113
113 -
 114
114 -
 115
115 -
 116
116 -
 117
117 -
 118
118 -
 119
119 -
 120
120 -
 121
121 -
 122
122 -
 123
123 -
 124
124 -
 125
125 -
 126
126 -
 127
127 -
 128
128 -
 129
129 -
 130
130 -
 131
131 -
 132
132 -
133
-
134
-
135
-
136
-
137
-
138
-
139
-
140
-
141
-
142
-
143
-
144
-
145
-
146
-
147
-
148
-
149
-
150
-
151
-
152
-
153
-
154
-
155
-
156
-
157
-
158
-
159
-
160
-
161
-
162
-
163
-
164
-
165
-
166
-
167
-
168
-
169
-
170
-
171
-
172
-
173
-
174
-
175
-
176
-
177
-
178
-
179
-
180
-
181
-
182
-
183
-
184
-
185
 |
 |

HEWLETT-PACKARD COMPANY AND SUBSIDIARIES
Notes to Consolidated Financial Statements (Continued)
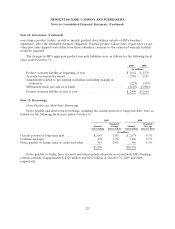
Note 10: Financial Instruments
Available-for-Sale Investments
Cash equivalents and investments at fair value for the following fiscal years ended October 31 were
as follows:
2009 2008
Gross Gross Gross Gross
Unrealized Unrealized Estimated Unrealized Unrealized Estimated
Cost Gain Loss Fair Value Cost Gain Loss Fair Value
In millions
Cash Equivalents
Time deposits ......... $ 8,870 $— $ — $ 8,870 $5,397 $— $ — $5,397
Commercial paper ...... 1,388 — — 1,388 1,306 — — 1,306
Money market funds .... 262 — — 262 919 — — 919
Total cash equivalents ..... $10,520 $— $ — $10,520 $7,622 $— $ — $7,622
Investments
Debt securities:
Time deposits ......... $ 55 $— $— $ 55 $ 103 $— $— $ 103
Other debt securities .... 419 49 (45) 423 104 1 (20) 85
Total debt securities ...... $ 474 $49 $(45) $ 478 $ 207 $ 1 $(20) $ 188
Equity securities in public
companies ........... $ 3 $ 2 $— $ 5 $ 3 $ 2 $— $ 5
Total cash equivalents and
investments ........... $10,997 $51 $(45) $11,003 $7,832 $ 3 $(20) $7,815
Cash equivalents consist of investments with original maturities of ninety days or less.
Available-for-sale securities consist of short-term investments which mature within twelve months or
less and long-term investments with maturities longer than twelve months. Investments include time
deposits consisting of certificate of deposits, corporate commercial paper and other debt securities
consisting primarily of fixed-interest securities and institutional bonds. As discussed in Note 9, HP
estimated the fair values of its investments based on quoted market prices or pricing models using
current market rates. These estimated fair values may not be representative of actual values that will be
realized in the future.
The gross unrealized loss as of October 31, 2009 was due primarily to declines in certain debt
securities. The gross unrealized loss includes $20 million that has been in a continuous loss position for
more than twelve months. The gross unrealized loss as of October 31, 2008 had been in a continuous
loss position for less than twelve months. HP does not intend to sell these debt securities and it is not
likely that HP will be required to sell these debt securities prior to the recovery of the amortized cost.
115