Harley Davidson 2011 Annual Report Download - page 7
Download and view the complete annual report
Please find page 7 of the 2011 Harley Davidson annual report below. You can navigate through the pages in the report by either clicking on the pages listed below, or by using the keyword search tool below to find specific information within the annual report.-
 1
1 -
 2
2 -
 3
3 -
 4
4 -
 5
5 -
 6
6 -
 7
7 -
 8
8 -
 9
9 -
 10
10 -
 11
11 -
 12
12 -
 13
13 -
 14
14 -
 15
15 -
 16
16 -
 17
17 -
 18
18 -
19
-
20
-
21
-
22
-
23
-
24
 |
 |

05
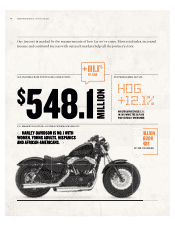
$378.8
2011 HDI REVENUE
RESTRUCTURING
MOTORCYCLES & RELATED
PRODUCTS OPERATING
INCOME (DOLLARS IN MILLIONS)
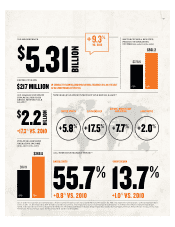
2011 HARLEY-DAVIDSON
FINANCIAL SERVICES
RETAIL MOTORCYCLE
LOANS(2)
FINANCIAL SERVICES
OPERATING INCOME
(DOLLARS IN MILLIONS)
NEW HARLEY-DAVIDSON MOTORCYCLE RETAIL SALES(3)
ALL-TIME HIGH MARKET SHARE(4)
$5.31
BILLION
55.7%
$217 MILLION
+0.8% VS. 2010
IN CUMULATIVE ANNUAL ONGOING SAVINGS THROUGH 2011 AS A RESULT
OF RESTRUCTURING ACTIVITIES 2010
$561.2
2011
UNITED STATES LATIN AMERICA
EUROPE, MIDDLE EAST
AND AFRICA ASIA PACIFIC
13.7%
+1.0% VS. 2010
EUROPE REGIONUNITED STATES
(1) U.S. market share position, on-road motorcycles, all sizes, based on the most current data available (full year 2010). Source: R.L. Polk & Co. motorcycle registration data. (2) Retail motorcycle loans
written in 2011. (3) 2011 compared to 2010 (4) Full-year market share, 651+cc. Percentage points increase is 2011 compared to 2010. Source: U.S., Motorcycle Industry Council; Europe Region,
ACEM, Association des Constructeurs Européens de Motocycles, The Motorcycle Industry in Europe. Europe Region data includes Austria, Belgium, Denmark, Finland, France, German, Greece, Italy,
Netherlands, Norway, Portugal, Spain, Sweden, Switzerland and the United Kingdom.
+17.3% VS. 2010
$2.2
BILLION
$181.9
2010
$268.8
2011
9.3%
VS. 2010