Honeywell 2013 Annual Report Download - page 7
Download and view the complete annual report
Please find page 7 of the 2013 Honeywell annual report below. You can navigate through the pages in the report by either clicking on the pages listed below, or by using the keyword search tool below to find specific information within the annual report.-
 1
1 -
 2
2 -
 3
3 -
 4
4 -
 5
5 -
 6
6 -
 7
7 -
 8
8 -
 9
9 -
 10
10 -
 11
11 -
 12
12 -
 13
13 -
 14
14 -
 15
15 -
 16
16 -
 17
17 -
 18
18 -
19
-
20
-
21
-
22
-
23
-
24
-
25
-
26
-
27
-
28
-
29
-
30
-
31
-
32
-
33
-
34
-
35
-
36
-
37
-
38
-
39
-
40
-
41
-
42
-
43
-
44
-
45
-
46
-
47
-
48
-
49
-
50
-
51
-
52
-
53
-
54
-
55
-
56
-
57
-
58
-
59
-
60
-
61
-
62
-
63
-
64
-
65
-
66
-
67
-
68
-
69
-
70
-
71
-
72
-
73
-
74
-
75
-
76
-
77
-
78
-
79
-
80
-
81
-
82
-
83
-
84
-
85
-
86
-
87
-
88
-
89
-
90
-
91
-
92
-
93
-
94
-
95
-
96
-
97
-
98
-
99
-
100
-
101
-
102
-
103
-
104
-
105
-
106
-
107
-
108
-
109
-
110
-
111
-
112
-
113
-
114
-
115
-
116
-
117
-
118
-
119
-
120
-
121
-
122
-
123
-
124
-
125
-
126
-
127
-
128
-
129
-
130
-
131
-
132
-
133
-
134
-
135
-
136
-
137
-
138
-
139
-
140
-
141
-
142
-
143
-
144
-
145
-
146
 |
 |

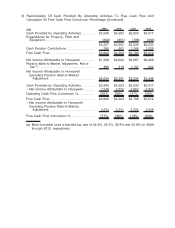
3) Reconciliation Of Cash Provided By Operating Activities To Free Cash Flow And
Calculation Of Free Cash Flow Conversion Percentage
($M) 2004 2005 2006 2007
Cash Provided by Operating Activities........... $2,253 $2,442 $3,211 $3,911
Expenditures for Property, Plant and Equipment . (629) (684) (733) (767)
$1,624 $1,758 $2,478 $3,144
Cash Pension Contributions . ................... 74 70 296 204
Free Cash Flow................................ $1,698 $1,828 $2,774 $3,348
Net Income Attributable to Honeywell ........... $1,442 $1,886 $2,289 $2,594
Pension Mark-to-Market Adjustment,
Net of Tax (a)................................. 58 21 20 9
Net Income Attributable to Honeywell
Excluding Pension Mark-to-Market Adjustment. $1,500 $1,907 $2,309 $2,603
Cash Provided by Operating Activities........... $2,253 $2,442 $3,211 $3,911
÷Net Income Attributable to Honeywell ......... 1,442 1,886 2,289 2,594
Operating Cash Flow Conversion %. ............ 156% 129% 140% 151%
Free Cash Flow................................ $1,698 $1,828 $2,774 $3,348
÷Net Income Attributable to Honeywell
Excluding Pension Mark-to-Market Adjustment. 1,500 1,907 2,309 2,603
Free Cash Flow Conversion % ................. 113% 96% 120% 129%
(a) Mark-to-market uses a blended tax rate of 30.0%, 32.3%, 28.6% and 30.8% for 2004
through 2007, respectively.