Honeywell 2014 Annual Report Download - page 12
Download and view the complete annual report
Please find page 12 of the 2014 Honeywell annual report below. You can navigate through the pages in the report by either clicking on the pages listed below, or by using the keyword search tool below to find specific information within the annual report.-
 1
1 -
 2
2 -
 3
3 -
 4
4 -
 5
5 -
 6
6 -
 7
7 -
 8
8 -
 9
9 -
 10
10 -
 11
11 -
 12
12 -
 13
13 -
 14
14 -
 15
15 -
 16
16 -
 17
17 -
 18
18 -
 19
19 -
 20
20 -
 21
21 -
 22
22 -
23
-
24
-
25
-
26
-
27
-
28
-
29
-
30
-
31
-
32
-
33
-
34
-
35
-
36
-
37
-
38
-
39
-
40
-
41
-
42
-
43
-
44
-
45
-
46
-
47
-
48
-
49
-
50
-
51
-
52
-
53
-
54
-
55
-
56
-
57
-
58
-
59
-
60
-
61
-
62
-
63
-
64
-
65
-
66
-
67
-
68
-
69
-
70
-
71
-
72
-
73
-
74
-
75
-
76
-
77
-
78
-
79
-
80
-
81
-
82
-
83
-
84
-
85
-
86
-
87
-
88
-
89
-
90
-
91
-
92
-
93
-
94
-
95
-
96
-
97
-
98
-
99
-
100
-
101
 |
 |

development programs, aftermarket spares and repairs and overhaul programs), increases in direct
foreign defense and space market sales, as well as our diversified commercial businesses.
Backlog
Our total backlog at December 31, 2014 and 2013 was $18,313 million and $17,512 million,
respectively. We anticipate that approximately $12,605 million of the 2014 backlog will be filled in 2015.
We believe that backlog is not necessarily a reliable indicator of our future sales because a substantial
portion of the orders constituting this backlog may be canceled at the customer’s option.
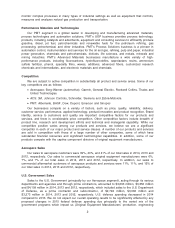
International Operations
We are engaged in manufacturing, sales, service and research and development globally. U.S.
exports and foreign manufactured products are significant to our operations. U.S. exports comprised
14% of our total sales in each of 2014, 2013 and 2012. Foreign manufactured products and services,
mainly in Europe and Asia, were 41% of our total sales in each of 2014, 2013 and 2012.
Manufactured Products and Systems and
Performance of Services Aerospace
Automation and
Control Solutions
Performance
Materials and
Technologies
Year Ended December 31, 2014
(% of Total Sales)
U.S. Exports . . . . . . . . . . . . . . . . . . . . . . . . . . . . . . . . . . . . . . . . . . . 20% 3% 21%
Non-U.S. . . . . . . . . . . . . . . . . . . . . . . . . . . . . . . . . . . . . . . . . . . . . . . 32% 67% 16%
Raw Materials
The principal raw materials used in our operations are generally readily available. Although we
occasionally experience disruption in raw materials supply, we experienced no significant problems in
the purchase of key raw materials or commodities in 2014. We are not dependent on any one supplier
for a material amount of our raw materials, except related to R240 (a key component in foam blowing
agents), a raw material used in our PMT segment.
The costs of certain key raw materials, including cumene, fluorspar, R240, natural gas,
perchloroethylene, sulfur and ethylene in our PMT business and nickel, steel, titanium and other
metals in our Aerospace business, are expected to continue to fluctuate. We will continue to attempt to
offset raw material cost increases with formula or long-term supply agreements, price increases and
hedging activities where feasible. We do not presently anticipate that a shortage of raw materials will
cause any material adverse impacts during 2015.
Patents, Trademarks, Licenses and Distribution Rights
Our segments are not dependent upon any single patent or related group of patents, or any
licenses or distribution rights. In our judgment, our intellectual property rights are adequate for the
conduct of our business. We believe that, in the aggregate, the rights under our patents, trademarks
and licenses are generally important to our operations, but we do not consider any individual patent,
trademark or any licensing or distribution rights related to a specific process or product, to be of
material importance in relation to our total business.
Research and Development
The Company’s principal research and development activities are in the U.S., India, Europe and
China. Research and development (R&D) expense totaled $1,892 million, $1,804 million and
$1,847 million in 2014, 2013 and 2012, respectively. The increase in R&D expense of 5% in 2014
compared to 2013 was primarily due to increased expenditures for new product development in our
ACS and PMT segments. Customer-sponsored (principally the U.S. Government) R&D activities
amounted to an additional $1,034 million, $969 million and $835 million in 2014, 2013 and 2012,
respectively.
3