Kohl's 2003 Annual Report Download - page 10
Download and view the complete annual report
Please find page 10 of the 2003 Kohl's annual report below. You can navigate through the pages in the report by either clicking on the pages listed below, or by using the keyword search tool below to find specific information within the annual report.-
 1
1 -
 2
2 -
 3
3 -
 4
4 -
 5
5 -
 6
6 -
 7
7 -
 8
8 -
 9
9 -
 10
10 -
 11
11 -
 12
12
 |
 |

8
Financial Summary
The management of Kohl’s Corporation is responsible for the integrity
and objectivity of the financial and operating information contained
in this Annual Report, including the consolidated financial statements
covered by the Report of the Independent Auditors. These statements
were prepared in conformity with generally accepted accounting principles
and include amounts that are based on the best estimates and judgments
of management.
The consolidated financial statements and related notes have been audited
by Ernst & Young LLP, independent auditors, whose report is based on
audits conducted in accordance with generally accepted auditing standards.
As part of its audit, the firm performed a review of the Company’s
system of internal controls and conducted such tests and employed
such procedures as considered necessary to render its opinion on the
consolidated financial statements. The Company’s consolidated financial
statements including the Report of the Independent Auditors is included
in the Company’s Form 10-K for the year ended January 31, 2004.
The Audit Committee of the Board of Directors is composed of four
independent Directors. The Committee is responsible for assisting the
Board in its oversight of Kohl’s financial accounting and reporting practices.
The Audit Committee is directly responsible for the compensation,
appointment and oversight of the Company’s independent auditors.
The Audit Committee meets periodically with the independent auditors,
as well as with management, to review accounting, auditing, internal
accounting control and financial reporting matters. The independent
auditors have unrestricted access to the Audit Committee.
Larry Montgomery Wesley S. McDonald
Chairman and Executive Vice President -
Chief Executive Officer Chief Financial Officer
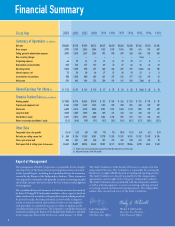
Fiscal Year 2003 2002 2001 2000 1999 1998 1997 1996 1995 1994 1993
Summary of Operations (In millions)
Net sales $10,282 $9,120 $7,489 $6,152 $4,557 $3,682 $3,060 $2,388 $1,926 $1,554 $1,306
Gross margin 3,395 3,139 2,565 2,096 1,543 1,235 1,014 780 631 516 437
Selling, general & administrative expenses 2,091 1,818 1,527 1,282 975 810 679 536 436 357 306
Non-recurring charges – – – – – – – – 14(a) – –
Preopening expenses 44 39 31 35 31 16 19 10 11 8 5
Depreciation and amortization 237 192 157 127 89 70 57 44 34 27 23
Operating income 1,023 1,090 850 651 448 338 259 189 136(a) 124 102
Interest expense, net 73 56 50 46 27 21 24 18 13 6 8
Income before income taxes 950 1,034 800 605 421 317 235 171 123 118 94
Net income 591 643 496 372 258 192 141 102 73(a) 69 54
Diluted Earnings Per Share(b) $1.72 $ 1.87 $ 1.45 $ 1.10 $ .77 $ .59 $ .45 $ .34 $ .24(a) $ .23 $ .18
Financial Position Data(Dollars in millions)
Working capital $ 1,902 $1,776 $1,584 $1,199 $ 732 $ 559 $ 525 $ 229 $ 175 $ 115 $ 87
Property and equipment, net 3,324 2,739 2,199 1,727 1,353 933 750 596 409 299 187
Total assets 6,698 6,316 4,930 3,855 2,931 1,936 1,620 1,123 805 659 469
Long-term debt 1,076 1,059 1,095 803 495 311 310 312 188 109 52
Shareholders’ equity 4,191 3,512 2,791 2,203 1,686 1,163 955 518 411 334 263
Return on average shareholders’ equity 15.3% 20.4% 19.9% 19.1% 18.1% 18.2% 19.2% 22.1% 21.7% 23.0% 23.7%
Other Data
Comparable store sales growth (1.6 )% 5.3% 6.8% 9.0% 7.9% 7.9% 10.0% 11.3% 5.9% 6.1% 8.3%
Net sales per selling square foot $ 268 $ 284 $ 283 $ 281 $ 270 $ 265 $ 267 $ 261 $ 257 $ 258 $ 255
Stores open at year end 542 457 382 320 259 213 182 150 128 108 90
Total square feet of selling space (In thousands) 41,447 34,507 28,576 23,610 18,757 15,111 12,533 10,064 8,378 6,824 5,523
(a) Includes a non-recurring credit operations charge of $14.1 million ($8.3 million after-tax) or $.03 per share.
(b) Adjusted for stock splits in 1996, 1998 and 2000.
Report of Management