Medtronic 2012 Annual Report Download - page 18
Download and view the complete annual report
Please find page 18 of the 2012 Medtronic annual report below. You can navigate through the pages in the report by either clicking on the pages listed below, or by using the keyword search tool below to find specific information within the annual report.-
 1
1 -
2
-
3
-
4
-
5
-
6
-
7
-
 8
8 -
 9
9 -
 10
10 -
 11
11 -
 12
12 -
 13
13 -
 14
14 -
 15
15 -
 16
16 -
 17
17 -
 18
18 -
 19
19 -
 20
20 -
 21
21 -
 22
22 -
 23
23 -
 24
24 -
 25
25 -
 26
26 -
 27
27 -
 28
28 -
29
-
30
-
31
-
32
-
33
-
34
-
35
-
36
-
37
-
38
-
39
-
40
-
41
-
42
-
43
-
44
-
45
-
46
-
47
-
48
-
49
-
50
-
51
-
52
-
53
-
54
-
55
-
56
-
57
-
58
-
59
-
60
-
61
-
62
-
63
-
64
-
65
-
66
-
67
-
68
-
69
-
70
-
71
-
72
-
73
-
74
-
75
-
76
-
77
-
78
-
79
-
80
-
81
-
82
-
83
-
84
-
85
-
86
-
87
-
88
-
89
-
90
-
91
-
92
-
93
-
94
-
95
-
96
-
97
-
98
-
99
-
100
-
101
-
102
-
103
-
104
-
105
-
106
-
107
-
108
-
109
-
110
-
111
-
112
-
113
-
114
-
115
-
116
-
117
-
118
-
119
-
120
-
121
-
122
-
123
-
124
-
125
-
126
-
127
-
128
-
129
-
130
-
131
-
132
-
133
-
134
-
135
-
136
-
137
-
138
-
139
-
140
-
141
-
142
-
143
-
144
-
145
-
146
-
147
-
148
-
149
-
150
-
151
-
152
 |
 |

PART I
Item 1. Business
Overview
Medtronic is the global leader in medical technology — alleviating pain, restoring health, and extending
life for millions of people around the world. Medtronic was founded in 1949, incorporated as a Minnesota
corporation in 1957, and today serves hospitals, physicians, clinicians, and patients in more than 120 countries
worldwide. We remain committed to a mission written by our founder more than 50 years ago that directs
us “to contribute to human welfare by the application of biomedical engineering in the research, design,
manufacture, and sale of products to alleviate pain, restore health, and extend life.”
We currently function in two operating segments that manufacture and sell device-based medical
therapies. Our operating segments are as follows:
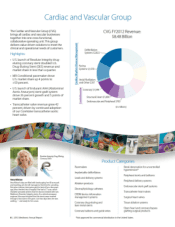
•Cardiac and Vascular Group
Cardiac Rhythm Disease Management (CRDM)
CardioVascular
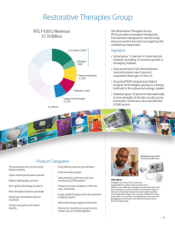
•Restorative Therapies Group
Spinal
Neuromodulation
Diabetes
Surgical Technologies
The chart above shows the net sales and percentage of total net sales contributed by each of our
operating segments for the fiscal year ended April 27, 2012 (fiscal year 2012). For more information please
see Note 19 to the consolidated financial statements in “Item 8. Financial Statements and Supplementary
Data” in this Annual Report on Form 10-K.
The results of operations, assets, and liabilities of the Physio-Control business, which were previously
presented as a component of the Cardiac and Vascular Group operating segment, are classified as
discontinued operations. All information, including the chart above, in this “Item 1. Business” includes only
results from continuing operations (excluding Physio-Control) for all periods presented, unless
otherwise noted. For further information regarding discontinued operations, see Note 3 to the consolidated
financial statements in “Item 8. Financial Statements and Supplementary Data” in this Annual Report on
Form 10-K.
With innovation and market leadership, we have pioneered advances in medical technology in all of our
businesses. Over the last five years, our net sales on a compounded annual growth basis have increased
more than 5 percent, from $13.186 billion in fiscal year 2008 to $16.184 billion in fiscal year 2012. Our
commitment to developing and acquiring new products to treat an expanding array of medical conditions
is driven by the following key imperatives:
• Providing economic value
• Accelerating globalization
Our primary customers include hospitals, clinics, third-party health care providers, distributors, and
other institutions, including governmental health care programs and group purchasing organizations.
1
Fiscal Year 2012
(dollars in millions)
Consolidated Net Sales $16,184
Total Cardiac and
Vascular Group
$8,482
Total Restorative
Therapies Group
$7,702
52%
48%