Medtronic 2015 Annual Report Download - page 4
Download and view the complete annual report
Please find page 4 of the 2015 Medtronic annual report below. You can navigate through the pages in the report by either clicking on the pages listed below, or by using the keyword search tool below to find specific information within the annual report.-
 1
1 -
 2
2 -
 3
3 -
 4
4 -
 5
5 -
 6
6 -
 7
7 -
 8
8 -
 9
9 -
 10
10 -
 11
11 -
 12
12 -
 13
13 -
 14
14 -
 15
15 -
16
-
17
-
18
-
19
-
20
-
21
-
22
-
23
-
24
-
25
-
26
-
27
-
28
-
29
-
30
-
31
-
32
-
33
-
34
-
35
-
36
-
37
-
38
-
39
-
40
-
41
-
42
-
43
-
44
-
45
-
46
-
47
-
48
-
49
-
50
-
51
-
52
-
53
-
54
-
55
-
56
-
57
-
58
-
59
-
60
-
61
-
62
-
63
-
64
-
65
-
66
-
67
-
68
-
69
-
70
-
71
-
72
-
73
-
74
-
75
-
76
-
77
-
78
-
79
-
80
-
81
-
82
-
83
-
84
-
85
-
86
-
87
-
88
-
89
-
90
-
91
-
92
-
93
-
94
-
95
-
96
-
97
-
98
-
99
-
100
-
101
-
102
-
103
-
104
-
105
-
106
-
107
-
108
-
109
-
110
-
111
-
112
-
113
-
114
-
115
-
116
-
117
-
118
-
119
-
120
-
121
-
122
-
123
-
124
-
125
-
126
-
127
-
128
-
129
-
130
-
131
-
132
-
133
-
134
-
135
-
136
-
137
-
138
-
139
-
140
-
141
-
142
-
143
-
144
-
145
-
146
-
147
-
148
-
149
-
150
-
151
-
152
-
153
-
154
-
155
-
156
-
157
-
158
-
159
-
160
-
161
-
162
-
163
-
164
-
165
-
166
 |
 |
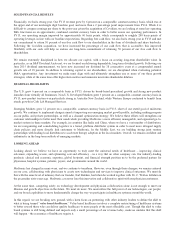
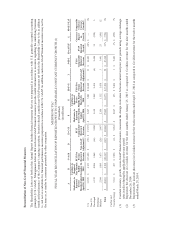
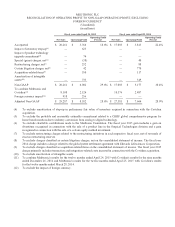
SOLID FINANCIAL RESULTS
Financially, we had a strong year. Our FY15 revenue grew by 6 percent on a comparable, constant currency basis, which was at
the upper end of our mid-single digit baseline goal, and more than a 2 percentage point improvement from FY14. While it is
difficult to compare earnings per share to the prior year given the acquisition of Covidien, we are looking at some key operating
P&L line items on an approximate, combined constant currency basis in order to better assess our operating performance. In
FY15, our operating margin improved by approximately 60 basis points, which corresponds to roughly 200 basis points of
operating leverage, in line with our baseline expectations. Regarding free cash flow, we also had a strong year in FY15 and met
our commitment to return 50 percent of our free cash flow to our shareholders in the form of dividends and share buybacks.
Following the Covidien acquisition, we have increased the percentage of our cash flow that is accessible; this improved
flexibility with our cash will help us sustain our long-term commitment of returning 50 percent of our free cash flow to
shareholders.
We remain extremely disciplined in how we allocate our capital, with a focus on creating long-term shareholder value. In
particular, as an S&P Dividend Aristocrat, we are focused on delivering dependable, long-term dividend growth. Following our
June 2015 dividend announcement, we have now increased our dividend for 38 consecutive years at a compounded annual
growth rate of 18 percent. In addition to returning capital to our shareholders, we are disciplined when evaluating potential
M&A opportunities. Any investment we make must align with and ultimately strengthen one or more of our three growth
strategies, while at the same time offer high return metrics and minimize near-term shareholder dilution.
REGIONAL HIGHLIGHTS
The U.S. grew 6 percent on a comparable basis in FY15, driven by broad-based procedural growth and strong new product
launches from virtually all businesses. Non-U.S. Developed Markets grew 3 percent on a comparable, constant currency basis in
FY15; new product traction was particularly strong in Australia-New Zealand, while Western Europe continued to benefit from
steady growth in Cath Lab Managed Services.
Emerging Markets grew 12 percent on a comparable, constant currency basis in FY15, short of our stated goal of mid-teens
growth. We continue to implement changes aimed at improving our emerging market growth profile, including making progress
on our public and private partnerships, as well as a channel optimization strategy. We believe these efforts will strengthen our
customer relationships to better meet their needs while providing Medtronic a more efficient, manageable, and organized go-to-
market system in these markets. For example, in countries like India and China, where we have a vast number of distributors,
we are reorganizing and consolidating logistics to a tiered, platform distributor system in order to meet more stringent supply
chain policies and more directly link customers to Medtronic. In the Middle East, we are building strong joint venture
partnerships with leading local distributors to accelerate therapy adoption in the local markets. Overall, we remain confident and
enthusiastic in the long-term outlook of emerging markets.
LOOKING AHEAD
Looking ahead, we believe we have an opportunity to truly meet the universal needs of healthcare – improving clinical
outcomes, expanding access, and optimizing cost and efficiency – in a way that no other company can. Our industry-leading
products, clinical and economic expertise, global footprint, and financial strength position us to be the preferred partner for
physicians, hospital systems, patients, payers, and governments around the world.
Medtronic has changed in many ways, and we continue to transform. However, even through these changes, we remain centered
on our core, collaborating with physicians to create new technologies and services to improve clinical outcomes. We must do
this with the same level of intimacy that our founder, Earl Bakken, had when he worked together with Dr. C. Walton Lillehei on
the pacemaker sixty years ago. Medtronic can never lose this innovative and collaborative spirit with our physician customers.
At the same time, competing solely on technology development and physician collaboration alone is not enough to meet our
Mission and growth objectives in the future. We must do more. We must utilize the full power of our technologies, our people,
and our broad capabilities to more fundamentally change the way we participate in healthcare systems around the world.
In this regard, we are breaking new ground, with a keen focus on partnering with other industry leaders to define the shift to
what is being termed “value based healthcare.” Value based healthcare involves a complete restructuring of healthcare systems
to better reward those who can deliver quality healthcare to more people at the most affordable cost. Though this shift to value
based systems is still being defined and impacts only a small percentage of our revenue today, make no mistake that this shift
will happen – the economics of healthcare require it.