Navy Federal Credit Union 2014 Annual Report Download - page 35
Download and view the complete annual report
Please find page 35 of the 2014 Navy Federal Credit Union annual report below. You can navigate through the pages in the report by either clicking on the pages listed below, or by using the keyword search tool below to find specific information within the annual report.-
 1
1 -
2
-
3
-
4
-
5
-
6
-
7
-
8
-
9
-
10
-
11
-
12
-
13
-
14
-
15
-
16
-
17
-
18
-
19
-
20
-
21
-
22
-
23
-
24
-
 25
25 -
 26
26 -
 27
27 -
 28
28 -
 29
29 -
 30
30 -
 31
31 -
 32
32 -
 33
33 -
 34
34 -
 35
35 -
 36
36 -
 37
37 -
 38
38 -
 39
39 -
 40
40 -
 41
41 -
 42
42 -
 43
43 -
 44
44 -
 45
45 -
46
-
47
-
48
-
49
-
50
-
51
-
52
-
53
-
54
-
55
-
56
-
57
-
58
-
59
-
60
-
61
-
62
-
63
-
64
-
65
-
66
-
67
-
68
-
69
-
70
-
71
-
72
 |
 |

Financial Section 17
2014 | A YEAR IN REVIEW
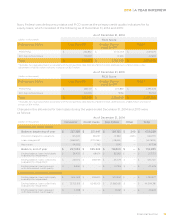
Navy Federal monitors the credit quality of its loan portfolio based on certain attributes and utilizes such
information to evaluate the appropriateness of the allowance for credit losses. Credit quality indicators
are obtained and updated quarterly. The following tables present credit quality indicators by loan product
type: consumer loans, credit card loans, mortgage loans and equity loans.
Navy Federal uses collateral type and FICO score as the primary credit quality indicators for its consumer
loans, which consisted of the following as of December 31, 2014 and 2013:
As of December 31, 2014
(dollars in thousands) FICO Score
Collateral Type Less than 610 Greater than or
equal to 610
Total(1)
Auto $ 2,209,261 $ 7,723,548 $ 9,932,809
Unsecured 676,042 1,964,527 2,640,569
Other Collateral 228,624 576,515 805,139
Total $ 3,113,927 $ 10,264,590 $ 13,378,517
(1)Excludes fair value adjustments associated with the acquired credit impaired (ACI) portfolio (See Note 6) of $1 million, deferred costs of
$13.0 million, business, net of $38.8 million, CLOC of $356.4 million, pre-approved consumer loans of $11.8 million and federal education
of $315.3 million.
As of December 31, 2013
(dollars in thousands) FICO Score
Collateral Type Less than 610 Greater than or
equal to 610
Total(1)
Auto $ 1,805,927 $ 6,580,749 $ 8,386,676
Unsecured 537,663 1,685,680 2,223,343
Other Collateral 216,076 531,747 747,823
Total $ 2,559,666 $ 8,798,176 $ 11,357,842
(1)Excludes fair value adjustments associated with the acquired credit impaired (ACI) portfolio (See Note 6) of $0.3 million, deferred costs
of $13.0 million, business, net of $23.1 million, CLOC of $312.6 million, pre-approved consumer loans of $16.4 million and federal education
of $356.5 million.