Nintendo 2015 Annual Report Download - page 30
Download and view the complete annual report
Please find page 30 of the 2015 Nintendo annual report below. You can navigate through the pages in the report by either clicking on the pages listed below, or by using the keyword search tool below to find specific information within the annual report.-
 1
1 -
2
-
3
-
4
-
5
-
6
-
7
-
8
-
9
-
10
-
11
-
12
-
13
-
14
-
15
-
16
-
17
-
18
-
19
-
 20
20 -
 21
21 -
 22
22 -
 23
23 -
 24
24 -
 25
25 -
 26
26 -
 27
27 -
 28
28 -
 29
29 -
 30
30 -
 31
31 -
 32
32 -
 33
33 -
 34
34 -
 35
35 -
 36
36 -
 37
37 -
 38
38 -
 39
39 -
 40
40 -
41
-
42
-
43
-
44
-
45
-
46
-
47
-
48
-
49
-
50
-
51
 |
 |

- 28 -
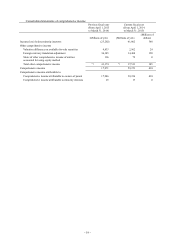
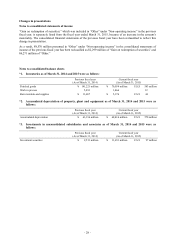
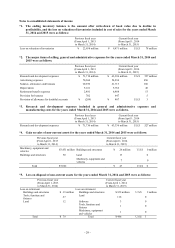
Changes in presentations
Notes to consolidated statements of income
“Gain on redemption of securities,” which was included in “Other” under “Non-operating income” in the previous
fiscal year, is separately listed from the fiscal year ended March 31, 2015, because of an increase in the amount’s
materiality. The consolidated financial statements of the previous fiscal year have been reclassified to reflect this
change in presentation.
As a result, ¥8,570 million presented in “Other” under “Non-operating income” in the consolidated statements of
income of the previous fiscal year has been reclassified as ¥2,299 million of “Gain on redemption of securities” and
¥6,271 million of “Other.”
Notes to consolidated balance sheets
*1. Inventories as of March 31, 2014 and 2015 were as follows:
Previous fiscal year
(As of March 31, 2014)
Current fiscal year
(As of March 31, 2015)
Finished goods ¥ 141,221 million ¥ 70,054 million U.S.$ 583 million
Work in process 5,891 1,466 12
Raw materials and supplies ¥ 13,687 ¥ 5,376 U.S.$ 44
*2. Accumulated depreciation of property, plant and equipment as of March 31, 2014 and 2015 were as
follows:
Previous fiscal year
(As of March 31, 2014)
Current fiscal year
(As of March 31, 2015)
Accumulated depreciation ¥ 63,136 million ¥ 68,416 million U.S.$ 570 million
*3. Investments in unconsolidated subsidiaries and associates as of March 31, 2014 and 2015 were as
follows:
Previous fiscal year
(As of March 31, 2014)
Current fiscal year
(As of March 31, 2015)
Investment securities ¥ 9,513 million ¥ 11,653 million U.S.$ 97 million