PG&E 2008 Annual Report Download - page 123
Download and view the complete annual report
Please find page 123 of the 2008 PG&E annual report below. You can navigate through the pages in the report by either clicking on the pages listed below, or by using the keyword search tool below to find specific information within the annual report.-
 1
1 -
2
-
3
-
4
-
5
-
6
-
7
-
8
-
9
-
10
-
11
-
12
-
13
-
14
-
15
-
16
-
17
-
18
-
19
-
20
-
21
-
22
-
23
-
24
-
25
-
26
-
27
-
28
-
29
-
30
-
31
-
32
-
33
-
34
-
35
-
36
-
37
-
38
-
39
-
40
-
41
-
42
-
43
-
44
-
45
-
46
-
47
-
48
-
49
-
50
-
51
-
52
-
53
-
54
-
55
-
56
-
57
-
58
-
59
-
60
-
61
-
62
-
63
-
64
-
65
-
66
-
67
-
68
-
69
-
70
-
71
-
72
-
73
-
74
-
75
-
76
-
77
-
78
-
79
-
80
-
81
-
82
-
83
-
84
-
85
-
86
-
87
-
88
-
89
-
90
-
91
-
92
-
93
-
94
-
95
-
96
-
97
-
98
-
99
-
100
-
101
-
102
-
103
-
104
-
105
-
106
-
107
-
108
-
109
-
110
-
111
-
112
-
 113
113 -
 114
114 -
 115
115 -
 116
116 -
 117
117 -
 118
118 -
 119
119 -
 120
120 -
 121
121 -
 122
122 -
 123
123 -
 124
124 -
 125
125 -
 126
126 -
 127
127 -
 128
128 -
 129
129 -
 130
130 -
 131
131 -
 132
132 -
 133
133 -
134
-
135
-
136
-
137
-
138
-
139
-
140
-
141
-
142
-
143
-
144
-
145
-
146
-
147
-
148
-
149
-
150
-
151
-
152
-
153
-
154
-
155
-
156
 |
 |

121
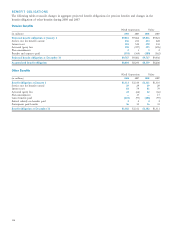
The carrying amount and fair value of PG&E Corporation’s and the Utility’s fi nancial instruments are as follows
(the table below excludes fi nancial instruments with fair values that approximate their carrying values, as these instruments
are presented at their carrying value in the Consolidated Balance Sheets):
At December 31,
2008 2007
Carrying Fair Carrying Fair
(in millions) Amount Value Amount Value
Debt (Note 4):
PG&E Corporation $ 280 $ 739 $ 280 $ 849
Utility 8,740 9,134 6,823 6,701
Energy recovery bonds (Note 5) 1,583 1,564 1,936 1,928
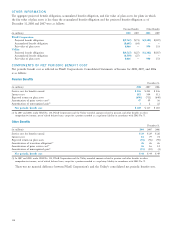
LEVEL 3 ROLLFORWARD
The following table is a reconciliation of changes in fair value of PG&E Corporation’s instruments that have been classifi ed
as Level 3 in the fair value hierarchy for the twelve month period ended December 31, 2008:
PG&E Corporation
Money Price Risk Nuclear Dividend
Market Management Decommissioning Long-term Participation
(in millions) Investments Instruments Trusts(3) Disability Rights Other Total
Asset (liability) Balance as of January 1, 2008 $ — $ 115(1) $ 8 $ 87 $(68)(2) $(4) $ 138
Realized and unrealized gains (losses):
Included in earnings — — — (34) (3) — (37)
Included in regulatory assets and liabilities
or balancing accounts — (271) (3) — — 2 (272)
Purchases, issuances, and settlements (50) — — 25 29 — 4
Transfers into Level 3 62 — — — — — 62
Asset (liability) Balance as of December 31, 2008 $ 12 $(156) $ 5 $ 78 $(42) $(2) $(105)
(1) Includes the impact of the $48 million retrospective adjustment related to CRRs on January 1, 2008. Additionally, the balance includes the impact
of netting adjustments of $6 million made in accordance with the requirements of FIN 39-1.
(2) The discount factor used to value these rights was adjusted on January 1, 2008 in order to comply with the provisions of SFAS No. 157, resulting in
a $6 million expense to increase the value of the liability.
(3) Excludes taxes on appreciation of investment value.
Earnings for the period were impacted by a $37 million unrealized loss relating to assets or liabilities still held at
December 31, 2008.
The following table is a reconciliation of changes in fair value of the Utility’s instruments that have been classifi ed as
Level 3 in the fair value hierarchy for the twelve month period ended December 31, 2008:
Utility
Price Risk Nuclear
Management Decommissioning Long-term
(in millions) Instruments Trusts(2) Disability Other Total
Asset (liability) Balance as of January 1, 2008 $ 115(1) $ 8 $ 87 $(4) $ 206
Realized and unrealized gains (losses):
Included in earnings — — (34) — (34)
Included in regulatory assets and liabilities or balancing accounts (271) (3) — 2 (272)
Purchases, issuances, and settlements — — 25 — 25
Transfers into (out of) Level 3 — — — — —
Asset (liability) Balance as of December 31, 2008 $(156) $ 5 $ 78 $(2) $ (75)
(1) Includes the impact of the $48 million retrospective adjustment related to CRRs on January 1, 2008. Additionally, the balance includes the impact
of netting adjustments of $6 million made in accordance with the requirements of FIN 39-1.
(2) Excludes taxes on appreciation of investment value.
Earnings for the period were impacted by a $34 million unrealized loss relating to assets or liabilities still held at
December 31, 2008.
PG&E Corporation and the Utility did not have any nonrecurring fi nancial measurements that are within the scope
of SFAS No. 157 as of December 31, 2008.