PG&E 2009 Annual Report Download - page 84
Download and view the complete annual report
Please find page 84 of the 2009 PG&E annual report below. You can navigate through the pages in the report by either clicking on the pages listed below, or by using the keyword search tool below to find specific information within the annual report.-
 1
1 -
2
-
3
-
4
-
5
-
6
-
7
-
8
-
9
-
10
-
11
-
12
-
13
-
14
-
15
-
16
-
17
-
18
-
19
-
20
-
21
-
22
-
23
-
24
-
25
-
26
-
27
-
28
-
29
-
30
-
31
-
32
-
33
-
34
-
35
-
36
-
37
-
38
-
39
-
40
-
41
-
42
-
43
-
44
-
45
-
46
-
47
-
48
-
49
-
50
-
51
-
52
-
53
-
54
-
55
-
56
-
57
-
58
-
59
-
60
-
61
-
62
-
63
-
64
-
65
-
66
-
67
-
68
-
69
-
70
-
71
-
72
-
73
-
 74
74 -
 75
75 -
 76
76 -
 77
77 -
 78
78 -
 79
79 -
 80
80 -
 81
81 -
 82
82 -
 83
83 -
 84
84 -
 85
85 -
 86
86 -
 87
87 -
 88
88 -
 89
89 -
 90
90 -
 91
91 -
 92
92 -
 93
93 -
 94
94 -
95
-
96
-
97
-
98
-
99
-
100
-
101
-
102
-
103
-
104
-
105
-
106
-
107
-
108
-
109
-
110
-
111
-
112
-
113
-
114
-
115
-
116
-
117
-
118
-
119
-
120
-
121
-
122
-
123
-
124
 |
 |

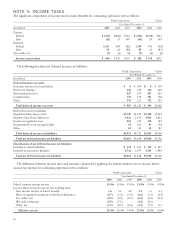
NOTE 9: INCOME TAXES
The significant components of income tax provision (benefit) for continuing operations were as follows:
PG&E Corporation Utility
Year Ended December 31,
(in millions) 2009 2008 2007 2009 2008 2007
Current:
Federal $ (747) $(268) $526 $ (696) $(188) $563
State (41) 33 140 (45) 24 149
Deferred:
Federal 1,161 604 (81) 1,139 596 (92)
State 92 62 (40) 89 62 (43)
Tax credits, net (5) (6) (6) (5) (6) (6)
Income tax provision $ 460 $ 425 $539 $ 482 $ 488 $571
The following describes net deferred income tax liabilities:
PG&E Corporation Utility
Year Ended December 31,
(in millions) 2009 2008 2009 2008
Deferred income tax assets:
Customer advances for construction $8$ 199 $8$ 199
Reserve for damages 138 130 138 129
Environmental reserve 227 225 227 225
Compensation 338 339 304 306
Other 176 231 172 201
Total deferred income tax assets $ 887 $1,124 $ 849 $1,060
Deferred income tax liabilities:
Regulatory balancing accounts $1,340 $1,425 $1,340 $1,425
Property related basis differences 4,036 2,819 4,032 2,813
Income tax regulatory asset 418 345 418 345
Unamortized loss on reacquired debt 93 102 93 102
Other 64 81 64 81
Total deferred income tax liabilities $5,951 $4,772 $5,947 $4,766
Total net deferred income tax liabilities $5,064 $3,648 $5,098 $3,706
Classification of net deferred income tax liabilities:
Included in current liabilities $ 332 $ 251 $ 334 $ 257
Included in noncurrent liabilities 4,732 3,397 4,764 3,449
Total net deferred income tax liabilities $5,064 $3,648 $5,098 $3,706
The differences between income taxes and amounts calculated by applying the federal statutory rate to income before
income tax expense for continuing operations were as follows:
PG&E Corporation Utility
Year Ended December 31,
2009 2008 2007 2009 2008 2007
Federal statutory income tax rate 35.0% 35.0% 35.0% 35.0% 35.0% 35.0%
Increase (decrease) in income tax rate resulting from:
State income tax (net of federal benefit) 1.6 3.1 4.2 1.4 3.3 4.3
Effect of regulatory treatment of fixed asset differences (2.7) (3.2) (3.0) (2.6) (3.1) (2.9)
Tax credits, net (0.5) (0.5) (0.7) (0.5) (0.5) (0.7)
IRS audit settlements (4.5) (7.1) – (4.2) (4.1) –
Other, net (1.5) (0.9) (0.6) (1.3) (1.7) 0.1
Effective tax rate 27.4% 26.4% 34.9% 27.8% 28.9% 35.8%
80