Suzuki 1998 Annual Report Download - page 16
Download and view the complete annual report
Please find page 16 of the 1998 Suzuki annual report below. You can navigate through the pages in the report by either clicking on the pages listed below, or by using the keyword search tool below to find specific information within the annual report.-
 1
1 -
2
-
3
-
4
-
5
-
 6
6 -
 7
7 -
 8
8 -
 9
9 -
 10
10 -
 11
11 -
 12
12 -
 13
13 -
 14
14 -
 15
15 -
 16
16 -
 17
17 -
 18
18 -
 19
19 -
 20
20 -
 21
21 -
 22
22 -
 23
23 -
 24
24 -
 25
25 -
 26
26 -
27
-
28
-
29
-
30
-
31
-
32
 |
 |

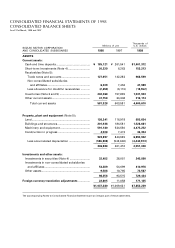
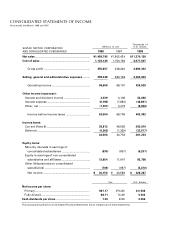
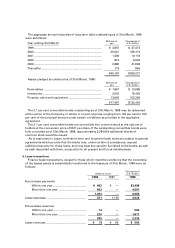
Millions of yen (Note A)
(except per share amounts)
Years ended 31st March 1998 1997 1996 1995 1994
Net sales............................... ¥1,179,136 ¥1,182,121 ¥1,120,944 ¥1,048,804 ¥1,008,659
Net income........................... 9,533 11,352 9,452 8,002 7,044
Net income per share:
Primary.............................. 21.23 25.30 21.07 17.84 15.90
Fully diluted ...................... 21.12 25.14 20.94 — —
Cash dividends per share ... 7.50 8.50 8.50 7.50 7.50
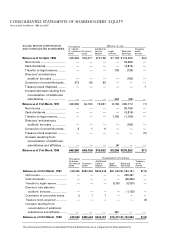
Shareholders’ equity ........... 247,350 241,780 234,224 228,245 223,710
Total current assets ............. 392,663 416,839 402,630 393,473 328,405
Total assets .......................... 723,487 717,716 690,961 685,168 621,975
Capital expenditure ............. 77,668 53,940 45,855 46,137 28,584
Depreciation and amortization....
47,339 42,987 42,702 50,507 51,785
Note A: All yen figures have been rounded down to millions of yen.
Non-consolidated
Thousands of U. S. dollars (Note B)
(except per share amounts)
Years ended 31st March 1998 1997 1996 1995 1994
Net sales............................... $8,926,090 $8,948,686 $8,485,572 $7,939,470 $7,635,575
Net income........................... 72,168 85,940 71,554 60,578 53,328
Net income per share:
Primary.............................. 0.161 0.192 0.160 0.135 0.120
Fully diluted ...................... 0.160 0.190 0.159 — —
Cash dividends per share ... 0.057 0.064 0.064 0.057 0.057
Shareholders’ equity ........... 1,872,445 1,830,286 1,773,088 1,727,824 1,693,496
Total current assets ............. 2,972,475 3,155,487 3,047,918 2,978,603 2,486,040
Total assets .......................... 5,476,815 5,433,127 5,230,595 5,186,739 4,708,371
Capital expenditure ............. 587,951 408,328 347,129 349,262 216,388
Depreciation and amortization....
358,359 325,416 323,257 382,344 392,019
Note B: Yen amounts have been translated into U. S. dollars, for convenience only, at ¥132.10=US$1, the prevailing
exchange rate on 31st March, 1998.