Suzuki 2006 Annual Report Download - page 44
Download and view the complete annual report
Please find page 44 of the 2006 Suzuki annual report below. You can navigate through the pages in the report by either clicking on the pages listed below, or by using the keyword search tool below to find specific information within the annual report.-
 1
1 -
2
-
3
-
4
-
5
-
6
-
7
-
8
-
9
-
10
-
11
-
12
-
13
-
14
-
15
-
16
-
17
-
18
-
19
-
20
-
21
-
22
-
23
-
24
-
25
-
26
-
27
-
28
-
29
-
30
-
31
-
32
-
33
-
 34
34 -
 35
35 -
 36
36 -
 37
37 -
 38
38 -
 39
39 -
 40
40 -
 41
41 -
 42
42 -
 43
43 -
 44
44 -
 45
45 -
 46
46 -
 47
47 -
 48
48 -
 49
49 -
 50
50 -
 51
51 -
 52
52 -
 53
53
 |
 |

SUZUKI MOTOR CORPORATION
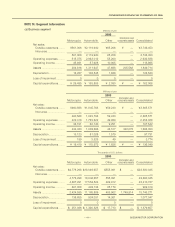
Millions of yen
2006
Elimination and
Motorcycle Automobile Other
corporate assets
Consolidated
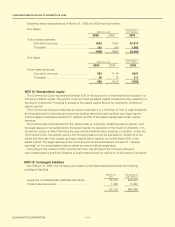
Net sales:
Outside customers ........ ¥561,306 ¥2,119,940 ¥65,206 ¥ — ¥2,746,453
Inter-area....................... — — — — —
561,306 2,119,940 65,206 — 2,746,453
Operating expenses ........ 515,375 2,062,012 55,200 — 2,632,588
Operating income ............ 45,931 57,928 10,005 — 113,865
Assets .............................. 284,816 1,311,647 47,688 205,562 1,849,714
Depreciation..................... 16,287 108,545 1,686 — 126,520
Loss of impairment........... 0 0 0 — 0
Capital expenditures ........ ¥ 29,495 ¥ 155,803 ¥ 2,080 ¥ — ¥ 162,068
Millions of yen
2005
Elimination and
Motorcycle Automobile Other
corporate assets
Consolidated
Net sales:
Outside customers ........ ¥460,568 ¥1,845,763 ¥59,240 ¥ — ¥2,365,571
Inter-area....................... — — — — —
460,568 1,845,763 59,240 — 2,365,571
Operating expenses ........ 422,416 1,785,622 49,989 — 2,258,028
Operating income ............ 38,151 60,140 9,251 — 107,542
Assets .............................. 244,480 1,083,686 43,107 322,078 1,693,353
Depreciation..................... 15,123 81,028 1,579 — 97,731
Loss of impairment........... 199 3,525 49 — 3,774
Capital expenditures ........ ¥ 18,419 ¥ 115,973 ¥ 1,656 ¥ — ¥ 136,049
Thousands of U.S. dollars
2006
Elimination and
Motorcycle Automobile Other
corporate assets
Consolidated
Net sales:
Outside customers ........ $4,778,298 $18,046,657 $555,091 $ — $23,380,045
Inter-area....................... — — — — —
4,778,298 18,046,657 555,091 — 23,380,045
Operating expenses ........ 4,387,291 17,553,524 469,912 — 22,410,727
Operating income ............ 391,008 493,133 85,179 — 969,319
Assets .............................. 2,424,585 11,165,809 405,962 1,749,914 15,746,271
Depreciation..................... 138,655 924,031 14,361 — 1,077,047
Loss of impairment........... 0 0 0 — 0
Capital expenditures ........ $ 251,086 $ 1,326,323 $ 17,713 $ — $ 1,379,657
NOTE 14: Segment Information
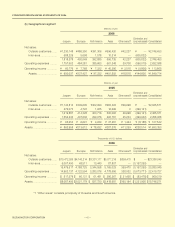
(a) Business segment
CONSOLIDATED FINANCIAL STATEMENTS OF 2006
44