Symantec 2013 Annual Report Download - page 87
Download and view the complete annual report
Please find page 87 of the 2013 Symantec annual report below. You can navigate through the pages in the report by either clicking on the pages listed below, or by using the keyword search tool below to find specific information within the annual report.-
 1
1 -
2
-
3
-
4
-
5
-
6
-
7
-
8
-
9
-
10
-
11
-
12
-
13
-
14
-
15
-
16
-
17
-
18
-
19
-
20
-
21
-
22
-
23
-
24
-
25
-
26
-
27
-
28
-
29
-
30
-
31
-
32
-
33
-
34
-
35
-
36
-
37
-
38
-
39
-
40
-
41
-
42
-
43
-
44
-
45
-
46
-
47
-
48
-
49
-
50
-
51
-
52
-
53
-
54
-
55
-
56
-
57
-
58
-
59
-
60
-
61
-
62
-
63
-
64
-
65
-
66
-
67
-
68
-
69
-
70
-
71
-
72
-
73
-
74
-
75
-
76
-
 77
77 -
 78
78 -
 79
79 -
 80
80 -
 81
81 -
 82
82 -
 83
83 -
 84
84 -
 85
85 -
 86
86 -
 87
87 -
 88
88 -
 89
89 -
 90
90 -
 91
91 -
 92
92 -
 93
93 -
 94
94 -
 95
95 -
 96
96 -
 97
97 -
98
-
99
-
100
-
101
-
102
-
103
-
104
-
105
-
106
-
107
-
108
-
109
-
110
-
111
-
112
-
113
-
114
-
115
-
116
-
117
-
118
-
119
-
120
-
121
-
122
-
123
-
124
-
125
-
126
-
127
-
128
-
129
-
130
-
131
-
132
-
133
-
134
-
135
-
136
-
137
-
138
-
139
-
140
-
141
-
142
-
143
-
144
-
145
-
146
-
147
-
148
-
149
-
150
-
151
-
152
-
153
-
154
-
155
-
156
-
157
-
158
-
159
-
160
-
161
-
162
-
163
-
164
-
165
-
166
-
167
-
168
-
169
-
170
-
171
-
172
-
173
-
174
-
175
-
176
-
177
-
178
-
179
-
180
-
181
-
182
-
183
-
184
-
185
-
186
-
187
-
188
-
189
-
190
-
191
-
192
-
193
-
194
-
195
-
196
-
197
-
198
-
199
-
200
-
201
-
202
-
203
-
204
 |
 |

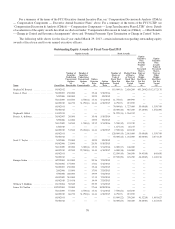
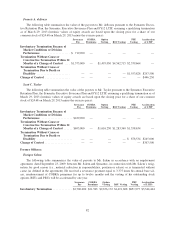
* The market value of the equity awards that have not vested is calculated by multiplying the number of units
that have not vested by the closing price of our common stock on March 28, 2013, which was $24.68.
(1) 28,750 shares to vest on 9/1/2013, 28,750 shares to vest on 9/1/2014, 28,750 shares to vest on 9/1/2015, and
28,750 shares to vest on 9/1/2016.
(2) 150,000 PCSUs eligible to vest when the Average Closing Price over a three-year period beginning with the
second quarter of fiscal 2013 first exceeds $20.00, and 150,000 PCSUs eligible to vest when the Average
Closing Price over a three-year period beginning with the second quarter of fiscal 2013 first exceeds
$22.00. Each PCSU is subject to the Compensation Committee’s certification when approving the settle-
ment thereof.
(3) Vests on 4/3/2015 based on, and subject to further adjustment as a result of, the achievement of the TSR
ranking for our company as compared to the S&P 500. The number of shares and the payout value for the
fiscal 2013 PRUs set forth above reflect the maximum potential payout since Symantec’s performance
during the first year of the three-year performance period has exceeded the target level. The maximum
potential payout represents 168% of the target number of PRUs. Each PRU is subject to the Compensation
Committee’s certification when approving the settlement thereof.
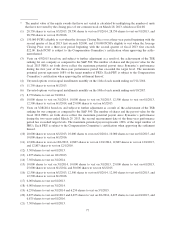
(4) Unvested options vest in equal installments monthly on the 11th of each month ending on 5/11/2016.
(5) 11,750 shares to vest on 6/1/2013.
(6) Unvested options vest in equal installments monthly on the 10th of each month ending on 6/10/2017.
(7) 8,750 shares to vest on 3/1/2014.
(8) 10,000 shares to vest on 3/1/2014, 10,000 shares to vest on 3/1/2015, 12,500 shares to vest on 6/1/2013,
12,500 shares to vest on 6/1/2014, and 25,000 shares to vest on 6/1/2015.
(9) Vests on 3/28/2014 based on, and subject to further adjustment as a result of, the achievement of the TSR
ranking for our company as compared to the S&P 500. The number of shares and the payout value for the
fiscal 2012 PRUs set forth above reflect the maximum potential payout since Symantec’s performance
during the two years ended March 29, 2013, the second measurement date of the three-year performance
period has exceeded target levels. The maximum potential payout represents 138% of the target number of
PRUs. Each PRU is subject to the Compensation Committee’s certification when approving the settlement
thereof.
(10) 10,000 shares to vest on 6/1/2013, 10,000 shares to vest on 6/1/2014, 10,000 shares to vest on 6/1/2015, and
10,000 shares to vest on 6/1/2016.
(11) 12,808 shares to vest on 12/1/2013, 12,807 shares to vest on 12/1/2014, 12,807 shares to vest on 12/1/2015,
and 12,807 shares to vest on 12/1/2016.
(12) 5,500 shares to vest on 6/1/2013.
(13) 1,875 shares to vest on 12/1/2013.
(14) 7,500 shares to vest on 3/1/2014.
(15) 10,000 shares to vest on 3/1/2014, 10,000 shares to vest on 3/1/2015, 25,000 shares to vest on 6/1/2013,
25,000 shares to vest on 6/1/2014, and 50,000 shares to vest on 6/1/2015.
(16) 12,500 shares to vest on 6/1/2013, 12,500 shares to vest on 6/1/2014, 12,500 shares to vest on 6/1/2015, and
12,500 shares to vest on 6/1/2016.
(17) 6,000 shares to vest on 6/1/2013.
(18) 6,000 shares to vest on 3/1/2014.
(19) 6,250 shares to vest on 3/1/2014 and 6,250 shares to vest on 3/1/2015.
(20) 6,875 shares to vest on 6/1/2013 and 6,875 shares to vest on 6/1/2014, 6,875 shares to vest on 6/1/2015, and
6,875 shares to vest on 6/1/2016.
(21) 7,500 shares to vest on 6/1/2013.
77