Target 2009 Annual Report Download - page 17
Download and view the complete annual report
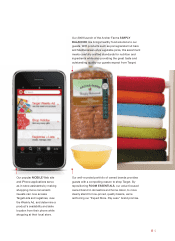
Please find page 17 of the 2009 Target annual report below. You can navigate through the pages in the report by either clicking on the pages listed below, or by using the keyword search tool below to find specific information within the annual report.-
 1
1 -
2
-
3
-
4
-
5
-
6
-
 7
7 -
 8
8 -
 9
9 -
 10
10 -
 11
11 -
 12
12 -
 13
13 -
 14
14 -
 15
15 -
 16
16 -
 17
17 -
 18
18 -
 19
19 -
 20
20 -
 21
21 -
 22
22 -
 23
23 -
 24
24 -
 25
25 -
 26
26 -
 27
27 -
28
-
29
-
30
-
31
-
32
-
33
-
34
-
35
-
36
-
37
-
38
-
39
-
40
-
41
-
42
-
43
-
44
-
45
-
46
-
47
-
48
-
49
-
50
-
51
-
52
-
53
-
54
-
55
-
56
-
57
-
58
-
59
-
60
-
61
-
62
-
63
-
64
-
65
-
66
-
67
-
68
-
69
-
70
-
71
-
72
-
73
-
74
-
75
-
76
-
77
-
78
-
79
-
80
-
81
-
82
-
83
-
84
-
85
-
86
-
87
-
88
 |
 |
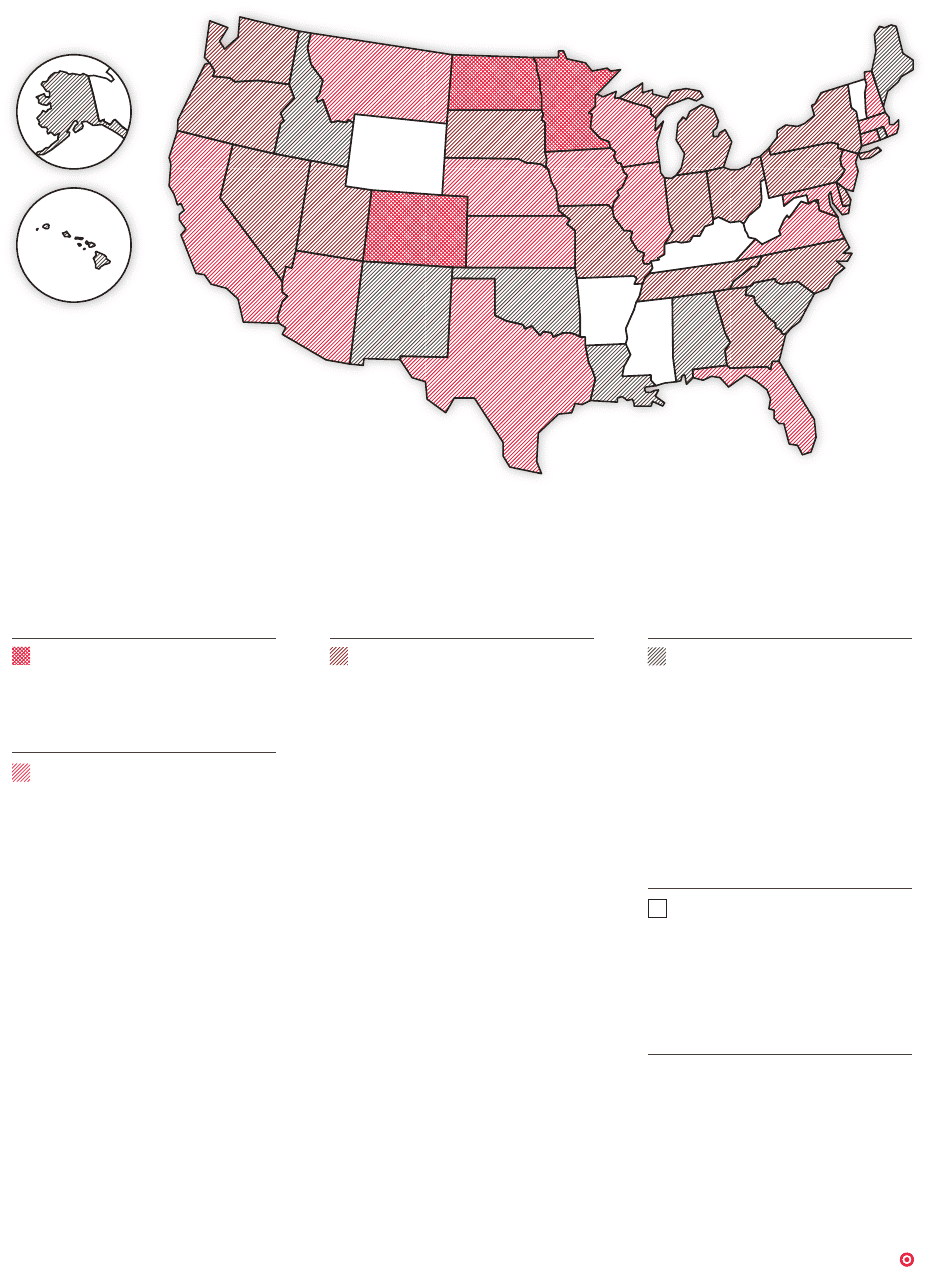
15
2009 sales per capita
Sales per capita is defined as sales by state divided by state population.
RETAIL
SALES PER NO. OF SQ. FT.
CAPITA GROUP STORES
(THOUSANDS)
$151–$200
Delaware 2 268
Georgia 55 7,517
Indiana 33 4,377
Michigan 60 7,141
Missouri 36 4,735
Nevada 19 2,461
New York 64 8,663
North Carolina 47 6,167
Ohio 63 7,868
Oregon 19 2,317
Pennsylvania 59 7,713
South Dakota 5 580
Tennessee 32 4,087
Utah 11 1,679
Washington 35 4,097
GROUP TOTAL 540 69,670
Year-end Store Count and Square Footage by State
RETAIL
SALES PER NO. OF SQ. FT.
CAPITA GROUP STORES
(THOUSANDS)
$101–$150
Alabama 20 2,867
Alaska 3 504
District of Columbia
1 179
Hawaii 3 542
Idaho 6 664
Louisiana 15 2,108
Maine 5 630
New Mexico 9 1,024
Oklahoma 14 2,022
Rhode Island 4 517
South Carolina 18 2,224
GROUP TOTAL 98 13,281
$0–$100
Arkansas 8 1,028
Kentucky 13 1,525
Mississippi 6 743
Vermont 0 0
West Virginia 6 755
Wyoming 2 187
GROUP TOTAL 35 4,238
TOTAL 1,740 231,941
RETAIL
SALES PER NO. OF SQ. FT.
CAPITA GROUP STORES
(THOUSANDS)
Over $300
Colorado 42 6,275
Minnesota 73 10,456
North Dakota 4 554
GROUP TOTAL 119 17,285
$201–$300
Arizona 48 6,363
California 244 32,184
Connecticut 20 2,672
Florida 126 17,644
Illinois 86 11,697
Iowa 22 3,015
Kansas 19 2,577
Maryland 36 4,663
Massachusetts 33 4,279
Montana 7 780
Nebraska 14 2,006
New Hampshire 9 1,148
New Jersey 43 5,671
Texas 148 20,838
Virginia 56 7,448
Wisconsin 37 4,482
GROUP TOTAL 948 127,467