Tesco 1999 Annual Report Download - page 4
Download and view the complete annual report
Please find page 4 of the 1999 Tesco annual report below. You can navigate through the pages in the report by either clicking on the pages listed below, or by using the keyword search tool below to find specific information within the annual report.-
 1
1 -
 2
2 -
 3
3 -
 4
4 -
 5
5 -
 6
6 -
 7
7 -
 8
8 -
 9
9 -
 10
10 -
 11
11 -
 12
12 -
 13
13 -
 14
14 -
 15
15 -
16
-
17
-
18
-
19
-
20
-
21
-
22
-
23
-
24
-
25
-
26
-
27
-
28
-
29
-
30
-
31
-
32
-
33
-
34
-
35
-
36
-
37
-
38
-
39
-
40
-
41
-
42
-
43
-
44
 |
 |

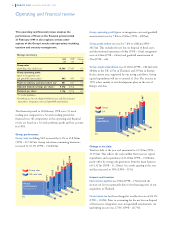
Operating and financial review
2 TESCO PLC ANNUAL REPORT 1999
Group operating profit (prior to integration costs and goodwill
amortisation) rose by 7.8% to £965m (1998 – £895m).
Group profit before tax rose by 7.8% to £881m (1998 –
£817m). This excludes the net loss on disposal of fixed assets
and discontinued operations of £8m (1998 – £9m), integration
costs of £26m (1998 – £63m) and goodwill amortisation of
£5m (1998 – nil).
Group capital expenditure was £1,067m (1998 – £841m) with
£848m in the UK, £27m in Thailand, and £192m in Europe.
In the current year, supported by our strong cash flows, Group
capital expenditure will rise to around £1.3bn. The increase in
1999 relates mainly to our development plans in the rest of
Europe and Asia.
Change in net debt
Total net debt at the year end amounted to £1,720m (1998 –
£1,191m). This reflects the cash outflow from our net capital
expenditure and acquisitions of £1,260m (1998 – £1,082m),
partly offset by strong cash generation from the main business
of £1,321m (1998 – £1,156m). As a result, gearing at the year
end has increased to 39% (1998 – 31%).
Interest and taxation
Net interest payable was £90m (1998 – £72m) with the
increase on last year primarily due to the financing costs of our
acquisition in Thailand.
Corporation tax has been charged at an effective rate of 28.1%
(1998 – 30.0%). Prior to accounting for the net loss on disposal
of fixed assets, integration costs and goodwill amortisation, our
underlying tax rate was 27.8% (1998 – 28.7%).
770
735
608
682
757
848
666
758
1,067
841
99
98
97
96
95
Group
UK
£m
Capital
expenditure
This operating and financial review analyses the
performance of Tesco in the financial period ended
27 February 1999. It also explains certain other
aspects of the Group’s results and operations including
taxation and treasury management.
The financial period to 28 February 1998 was a 53 week
trading year compared to a 52 week trading period this
financial year. All comparisons in this operating and financial
review are based on a 52 week proforma profit and loss account
for 1998.
Group performance
Group sales including VAT increased by 6.3% to £18,546m
(1998 – £17,447m). Group sales from continuing businesses
increased by 10.1% (1998 – £16,847m).
10,877
10,380
12,430
14,024
15,799*
17,070
13,028
14,984
18,546
17,447*
99
98
97
96
95
Group sales
UK retail sales
£m
Group
performance
*52 weeks proforma
Group summary
1999 1998* Change
£m £m %
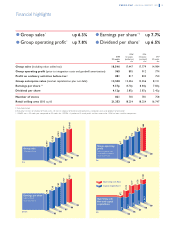
Group sales
(including value added tax) 18,546 17,447 6.3
Group operating profit
(prior to integration costs
and goodwill amortisation) 965 895 7.8
Profit on ordinary activities before tax†881 817 7.8
Adjusted diluted earnings per share†9.37p 8.70p 7.7
Dividend per share 4.12p 3.87p 6.5
*52 weeks proforma
†Excluding net loss on disposal of fixed assets and discontinued
operations, integration costs and goodwill amortisation