Tesco 2000 Annual Report Download - page 5
Download and view the complete annual report
Please find page 5 of the 2000 Tesco annual report below. You can navigate through the pages in the report by either clicking on the pages listed below, or by using the keyword search tool below to find specific information within the annual report.-
 1
1 -
 2
2 -
 3
3 -
 4
4 -
 5
5 -
 6
6 -
 7
7 -
 8
8 -
 9
9 -
 10
10 -
 11
11 -
 12
12 -
 13
13 -
 14
14 -
 15
15 -
 16
16 -
17
-
18
-
19
-
20
-
21
-
22
-
23
-
24
-
25
-
26
-
27
-
28
-
29
-
30
-
31
-
32
-
33
-
34
-
35
-
36
-
37
-
38
-
39
-
40
-
41
-
42
-
43
-
44
 |
 |

TESCO PLC
3
Shareholders’ funds, before minority interests, increased by £387m.
This was due to retained profits of £372m and issue of new shares
less expenses of £51m, offset by losses on foreign currency
translation of £36m. As a result, return on shareholders’ funds
was 20.9%.
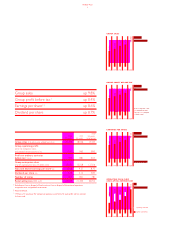
Total shareholder return, which is measured as the percentage
change in the share price plus the dividend, has been 19.4% over
the last five years, compared to the market average of 18.9% and
has been 18.3% over the last three years, compared to the market
average of 15.4%. In the last year, total shareholder return in Tesco
has been (0.5)% compared to the market average of 8.5%.
UK
UK sales (excluding property development sales) grew by 7.4% to
£18,331m (1999 – £17,070m) of which 4.2% came from existing
stores and 3.2% from net new stores.
Inflation in our UK business totalled 1.0% for the year due
entirely to duty increases on petrol, tobacco and alcohol. Through
our significant price investment we have seen volume gains and
deflation in our core business.
This year we experienced tough trading conditions. In this
environment Tesco continues to perform well above the market
and was one of the very few major retailers to deliver continued
profit growth.
UK operating profit was 8.1% higher at £993m (1999 – £919m)
with an operating margin held broadly flat at 5.9%.
Store development and capital expenditure UK capital
expenditure included £579m on opening 38 new stores comprising
one Extra, 13 Superstores, 14 Compact stores and ten Express
stores. We also spent £182m on our refit and extension programmes.
In total we opened 1.2m sq ft of new space and expect to open a
similar amount in the current year.
POPULATION 59m
MARKET SHARE 15.5%
NUMBER OF STORES 659
SQUARE FOOTAGE 000s 16,895
STORES OPENED/SQ FT ADDED 38 / 1,216,500
CAPITAL EXPENDITURE £m 989
TURNOVER £m 18,331
OPERATING PROFIT £m 993
one year three years five years
8.5
18.3
19.4
%
Tesco
market
TOTAL SHAREHOLDER RETURN
1996 1997 1998 1999 2000
19.8
12.8
12.7*
8.0
7.4
%
total UK growth
UK like-for-like
sales growth
SALES GROWTH
*52 weeks pro forma
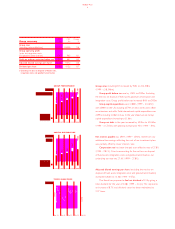
UK fact file
2000 1999 Change
UK performance £m £m %
Retail sales
(including value added tax) 18,331 17,070 7.4
Operating profit 993 919 8.1
1996 1997 1998 1999 2000
685
603
680
837
1,216
000 sq ft
UK sales area opened
including Express
UK SALES AREA
(0.5)
8.9
7.5
6.1
4.0
4.2
15.4
18.9