Tesco 2005 Annual Report Download - page 3
Download and view the complete annual report
Please find page 3 of the 2005 Tesco annual report below. You can navigate through the pages in the report by either clicking on the pages listed below, or by using the keyword search tool below to find specific information within the annual report.-
 1
1 -
 2
2 -
 3
3 -
 4
4 -
 5
5 -
 6
6 -
 7
7 -
 8
8 -
 9
9 -
 10
10 -
 11
11 -
 12
12 -
 13
13 -
 14
14 -
15
-
16
-
17
-
18
-
19
-
20
-
21
-
22
-
23
-
24
-
25
-
26
-
27
-
28
-
29
-
30
-
31
-
32
-
33
-
34
-
35
-
36
-
37
-
38
-
39
-
40
-
41
-
42
-
43
-
44
-
45
-
46
-
47
-
48
-
49
-
50
-
51
-
52
-
53
-
54
-
55
-
56
-
57
-
58
-
59
-
60
-
61
-
62
-
63
-
64
-
65
-
66
-
67
-
68
 |
 |

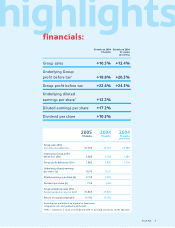
highlights
financials:
Tesco PLC 1
Growth on 2004 Growth on 2004
53 weeks 52 weeks
pro forma
Group sales +10.5% +12.4%
Underlying Group
profit before tax†+18.8% +20.5%
Group profit before tax +22.6% +24.5%
Underlying diluted
earnings per share†+12.2%
Diluted earnings per share +17.2%
Dividend per share +10.5%
2005 2004 2004
52 weeks 53 weeks 52 weeks
pro forma
Group sales (£m)
(including value added tax) 37,070 33,557 32,989
Underlying Group profit
before tax†(£m) 2,029 1,708 1,684
Group profit before tax (£m) 1,962 1,600 1,576
Underlying diluted earnings
per share†(p) 18.30 16.31
Diluted earnings per share (p) 17.50 14.93
Dividend per share (p) 7.56 6.84
Group enterprise value (£m)
(market capitalisation plus net debt) 27,853 23,866
Return on capital employed#11.5% 10.4%
†Excluding net profit/(loss) on disposal of fixed assets,
integration costs and goodwill amortisation.
#2004 – restated as a result of UITF 38 and UITF 17 (revised), previously 10.5%. See note 1.