Tesco 2006 Annual Report Download - page 4
Download and view the complete annual report
Please find page 4 of the 2006 Tesco annual report below. You can navigate through the pages in the report by either clicking on the pages listed below, or by using the keyword search tool below to find specific information within the annual report.-
 1
1 -
 2
2 -
 3
3 -
 4
4 -
 5
5 -
 6
6 -
 7
7 -
 8
8 -
 9
9 -
 10
10 -
 11
11 -
 12
12 -
 13
13 -
 14
14 -
 15
15 -
16
-
17
-
18
-
19
-
20
-
21
-
22
-
23
-
24
-
25
-
26
-
27
-
28
-
29
-
30
-
31
-
32
-
33
-
34
-
35
-
36
-
37
-
38
-
39
-
40
-
41
-
42
-
43
-
44
-
45
-
46
-
47
-
48
-
49
-
50
-
51
-
52
-
53
-
54
-
55
-
56
-
57
-
58
-
59
-
60
-
61
-
62
-
63
-
64
-
65
-
66
-
67
-
68
-
69
-
70
-
71
-
72
-
73
-
74
-
75
-
76
-
77
-
78
-
79
-
80
-
81
-
82
-
83
-
84
-
85
-
86
-
87
-
88
-
89
-
90
-
91
-
92
-
93
-
94
-
95
-
96
-
97
-
98
-
99
-
100
-
101
-
102
-
103
-
104
-
105
-
106
-
107
-
108
-
109
-
110
-
111
-
112
-
113
-
114
-
115
-
116
 |
 |

2 Tesco plc
4
Finest is the
premium Tesco
brand with over
1,500 products,
including
non-food lines.
4
Our Express stores
bring better quality
and lower prices to
local neighbourhoods.
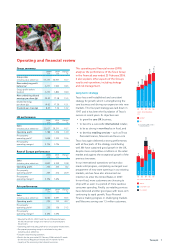
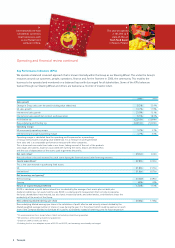
Key IFRS profit measures and UK GAAP equivalent measures
52-Week comparison basis
IFRS UK GAAP equivalent*
2006 2005 Growth 2006 2005 Growth
Group profit before tax (£m) 2,210 1,894 16.7% 2,287 1,962 16.6%
New underlying profit (£m) 2,251 1,925 16.9% n/a n/a n/a
Pre-IFRS Group underlying profit†(£m) n/a n/a n/a 2,307 2,029 13.7%
UK operating profit (£m)#1,788 1,556 14.9% 1,858 1,694 9.7%
Asiaoperating profit (£m)#200 153 30.7% 200 152 31.6%
Europe operating profit (£m)#265 243 9.1% 272 218 24.8%
Joint ventures & Associates (£m)‡82 74 10.8% 160 135 18.5%
Underlying diluted EPS(p) 20.06 17.58 14.1% 20.43 18.30 11.6%
* Under UK GAAP, Taiwan losses are included.
†Underlying pre-tax profit excluded net profit or loss on disposal of fixed assets, integration costs and goodwill amortisation.
‡Under IFRSs Joint ventures and Associates profit is reported net of interest and tax.
#Under UK GAAP, our operating profit measure excluded net profit or loss on disposal of fixed assets, integration costs
and goodwill amortisation.
Operating and financial review continued
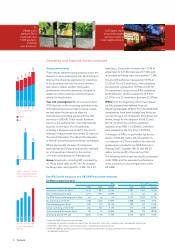
Group performance
These results represent good progress across the
Group in a more challenging year. By investing to
improve the shopping experience for customers
in our businesses around the world, we have
been able to deliver another strong sales
performance, meet the demands of higher oil-
related and other external costs and improve
returns for shareholders.
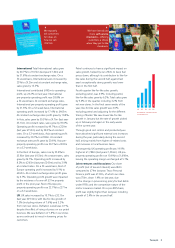
Year end convergence We announced in April
2005 that due to the increasing contribution our
International businesses make to Group results,
we had taken the decision to align our
International accounting period with the UK’s
year-end in 2005/06. These results therefore
report on the performance of our International
businesson the basis of a 60-week year,
including a 36-week second half to the end of
February, compared with the normal 52 weeks to
the end of December.The UK and the Republic
of Ireland’s accounting periods remain unchanged.
Where appropriate, for ease of comparison,
International and Group results are also reported
on a 52-week basis (based on the normal
12 month calendar year for International).
Group Group sales, including VAT,increased by
16.7% at actual rates to £43.1bn. At constant
exchange rates, sales grew by 15.0%. On a 52-
week basis, Group sales increased by 13.2% at
actual rates to £41.8bn (last year £37.0bn) and
at constant exchange rates sales grew by 11.6%.
Group profit before tax increased by 18.0% to
£2,235m. On a 52-week basis, new underlying
pre-tax profit increased by 16.9% to £2,251m.
For comparison, using our pre-IFRS underlying
profit definition, profit increased by 13.7% to
£2,307m on a 52-week basis (last year £2,029m).
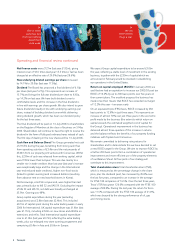
IFRSs From the beginning of the financial year
we fully adopted International Financial
Reporting Standards (IFRSs). Prior year (2004/05)
comparatives have been restated and these are
used as the basis for comparison throughout this
review, except for the adoption of IAS 32 and
IAS 39, for which we used the exemption
available under IFRS 1 in 2004/05, and which
were adopted for the first time in 2005/06.
The impactof IFRSs on profit after tax for the
whole of 2005/06, before IAS 32 and IAS 39,
is a reduction of £37m, broadly in line with the
guidance we provided at our IFRS Seminar in
February 2005. Together, IAS 32 and IAS 39
reducepre-tax profit in the year by £13m.
The following table shows key results as reported
under IFRSs and the equivalent performance
using our previous accounting policies under
UK GAAP.
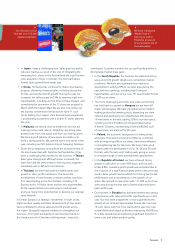
02 03 0504
CAPITAL EXPENDITURE
£m
2,134
2,027
1,228
2,2851,520
06
2,8021,795
2,4501,704
1,276
GROUP
UK
02 0403
UK SALES AREA OPENED
000 sq ft
1,433
05
1,778
06
2,008
1,519
1,296
1year 3 years 5 years
TOTA LSHAREHOLDERRETURN
RELATIVETO THE FTSE 100 (%)
29.5
46.0
(9.5)