Tesco 2014 Annual Report Download - page 21
Download and view the complete annual report
Please find page 21 of the 2014 Tesco annual report below. You can navigate through the pages in the report by either clicking on the pages listed below, or by using the keyword search tool below to find specific information within the annual report.-
 1
1 -
2
-
3
-
4
-
5
-
6
-
7
-
8
-
9
-
10
-
 11
11 -
 12
12 -
 13
13 -
 14
14 -
 15
15 -
 16
16 -
 17
17 -
 18
18 -
 19
19 -
 20
20 -
 21
21 -
 22
22 -
 23
23 -
 24
24 -
 25
25 -
 26
26 -
 27
27 -
 28
28 -
 29
29 -
 30
30 -
 31
31 -
32
-
33
-
34
-
35
-
36
-
37
-
38
-
39
-
40
-
41
-
42
-
43
-
44
-
45
-
46
-
47
-
48
-
49
-
50
-
51
-
52
-
53
-
54
-
55
-
56
-
57
-
58
-
59
-
60
-
61
-
62
-
63
-
64
-
65
-
66
-
67
-
68
-
69
-
70
-
71
-
72
-
73
-
74
-
75
-
76
-
77
-
78
-
79
-
80
-
81
-
82
-
83
-
84
-
85
-
86
-
87
-
88
-
89
-
90
-
91
-
92
-
93
-
94
-
95
-
96
-
97
-
98
-
99
-
100
-
101
-
102
-
103
-
104
-
105
-
106
-
107
-
108
-
109
-
110
-
111
-
112
-
113
-
114
-
115
-
116
-
117
-
118
-
119
-
120
-
121
-
122
-
123
-
124
-
125
-
126
-
127
-
128
-
129
-
130
-
131
-
132
-
133
-
134
-
135
-
136
-
137
-
138
-
139
-
140
-
141
-
142
-
143
-
144
-
145
-
146
-
147
 |
 |

14.7%†
12.7%
10/11 11/12 12/13 13/14
£2,504m £2,478m £2,272m £2,191m
12.7%
10/11 11/12 12/13*13/14
£946m
£1,266m
£1,062m
£930m
14.7%†
11/12 12/13 13/14
Trading profit
£194m
£191m
£225m
Profit excluding legacy income
and fair value releases
11/12 12/13 13/14
£189m
£158m
£140m
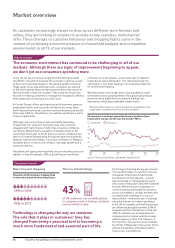
We have previously reported a number of other performance indicators and on this page we
continue to report against those measures under our strategic priorities and scale for good.
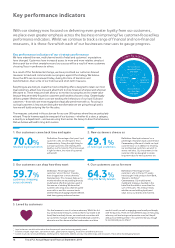
UK like-for-like (inc. VAT, exc. petrol) UK trading profit
10/11 11/12 12/13 13/14
1.0% 0.0% (0.3)% (1.3)%
Performance
UK like-for-like (the growth in sales from stores that have been open for
at least a year) was (0.5)% for the first half and (2.2)% in the second half.
Further weakness in the grocery market, exacerbated by a lower level of
inflation, impacted our sales performance towards the end of the year
and this contributed to the overall sales performance for the year.
Performance
UK trading profit declined by (3.6)% with a lower trading margin of 5.0%,
reflecting our continued determination to invest in our customer offer
despite the weakening UK grocery market.
International trading profitBank profit
Performance
International trading profit fell reflecting the difficult trading conditions in
Europe, the impact of opening hours regulations in South Korea and political
unrest in Thailand, in addition to its weak economy.
* The 2012/13 figure including China was £990m.
Performance
Excluding income from the legacy insurance distribution agreement which
terminated in 2012/13 and fair value releases resulting from the unwind of
an acquisition accounting adjustment, profit grew by 19%.
Reduction in CO2e emissions from
existing stores and distribution centres
Partner viewpoint – percentage of positive
responses to the question ‘I am treated with respect’
Donation of pre-tax profits to charities
and good causes
Performance
As indicated in the 2012/13 Annual Report, we are
now measuring the cumulative reduction in CO2e
across our property against a 2006/7 baseline,
consistent with our 2020 target to halve the emissions
per square foot of our stores and DCs. The reduction
continues to be driven by our strong focus on reducing
refrigerant gas leakage and using less harmful
alternatives, including natural refrigerants.
10/11 11/12 12/13 13/14
n/a n/a 32.5% 34.7%
Performance
This year we fulfilled our commitment to improve our
anonymous partner viewpoint survey by making it more
comprehensive and ensuring it reaches more suppliers.
The survey is helping us to understand more about how
our supplier partners are feeling, and allows us to focus
on the categories and countries where we need to work
harder to ensure we always treat our partners with
respect. We are committed to building longer-term
strong strategic relationships, and our teams are very
focused on improving this score.
Performance
We have donated almost £53 million to charities
and good causes this year through direct donations,
cause-related marketing, gifts in kind, colleague time
and management costs. This represents 2.3% of our
statutory profit before tax. The total that we have donated
is lower this year, largely due to the transition from Tesco
for Schools and Clubs to our Eat Happy initiative.
*
The 2012/13 figure excluding the contribution from
Fresh & Easy in the US was £66m.
£53m
down £13m* from 2013
Colleague retention
90%
in the UK
down 1% from 2013
Performance
Colleague retention in the UK
continues to be very strong. This
reflects our determination to make
Tesco a great place to work, with
excellent benefits and career
development opportunities.
6.2%
across the Group
+0.7% from 2013
67%
down 4% from 2013
Performance
Training and development is really important to us.
This measure is the percentage of colleagues participating
in our development programmes. As our learning and
development programmes have matured we now include
a broad portfolio in our measure: ‘Options’, Advanced
Leadership and Group Leadership Programmes as well as
our Apprenticeship, Graduate, Operations and Commercial
Programmes. In 2012/13 this figure excluding China was 5.5%.
Colleagues being trained for their next role
Our strategic priorities
Using our scale for good
In addition to the discussion around employee, environmental, community and social issues embedded in this Strategic Report, you can find a great deal more information in our
Tesco and Society Report (www.tescoplc.com/society) about how we are starting to tackle three urgent issues facing society – food waste, improving health and youth unemployment.
It also shows how we are strengthening our work in the four essential areas – trading responsibly, reducing our impact on the environment, being a great employer and supporting
local communities – which are fundamental to the way we do business.
18 Tesco PLC Annual Report and Financial Statements 2014
Key performance indicators continued