UPS 2014 Annual Report Download - page 43
Download and view the complete annual report
Please find page 43 of the 2014 UPS annual report below. You can navigate through the pages in the report by either clicking on the pages listed below, or by using the keyword search tool below to find specific information within the annual report.-
 1
1 -
2
-
3
-
4
-
5
-
6
-
7
-
8
-
9
-
10
-
11
-
12
-
13
-
14
-
15
-
16
-
17
-
18
-
19
-
20
-
21
-
22
-
23
-
24
-
25
-
26
-
27
-
28
-
29
-
30
-
31
-
32
-
 33
33 -
 34
34 -
 35
35 -
 36
36 -
 37
37 -
 38
38 -
 39
39 -
 40
40 -
 41
41 -
 42
42 -
 43
43 -
 44
44 -
 45
45 -
 46
46 -
 47
47 -
 48
48 -
 49
49 -
 50
50 -
 51
51 -
 52
52 -
 53
53 -
54
-
55
-
56
-
57
-
58
-
59
-
60
-
61
-
62
-
63
-
64
-
65
-
66
-
67
-
68
-
69
-
70
-
71
-
72
-
73
-
74
-
75
-
76
-
77
-
78
-
79
-
80
-
81
-
82
-
83
-
84
-
85
-
86
-
87
-
88
-
89
-
90
-
91
-
92
-
93
-
94
-
95
-
96
-
97
-
98
-
99
-
100
-
101
-
102
-
103
-
104
-
105
-
106
-
107
-
108
-
109
-
110
-
111
-
112
-
113
-
114
-
115
-
116
-
117
-
118
-
119
-
120
-
121
-
122
-
123
-
124
-
125
-
126
-
127
-
128
-
129
-
130
-
131
-
132
-
133
-
134
-
135
-
136
-
137
-
138
-
139
-
140
 |
 |
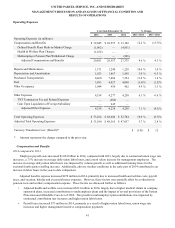
UNITED PARCEL SERVICE, INC. AND SUBSIDIARIES
MANAGEMENT'S DISCUSSION AND ANALYSIS OF FINANCIAL CONDITION AND
RESULTS OF OPERATIONS
31
Among our air products, volume increased in 2013 compared with 2012, as growth in our deferred products more than
offset a small decline in our Next Day Air services. Solid air volume growth continued for those products most aligned with
business-to-consumer shipping, including our residential Second Day Air package and residential Next Day Air Saver products.
Next Day Air letter volume decreased approximately 7% for the year, and was negatively impacted by competitive losses and
slowing growth in the financial services industry. Our business-to-business air volume continued to be impacted by sluggish
economic conditions in the U.S., low levels of inventory replenishment among our customers and changes in our customers'
supply chain networks. The combination of these factors influenced our customers' sensitivity towards the price and speed of
shipments, and therefore the use of our premium air services.
The increase in ground volume in 2013 was primarily attributed to our traditional residential service offerings and
SurePost. Demand for these residential products continues to be driven by business-to-consumer shipping activity from e-
commerce retailers and other large customers. Business-to-business ground volume also showed a small increase, and was
positively impacted by the overall expansion of the U.S. retail sector; however, continued weakness in industrial production
hindered growth. The increased use of omni-channel retailing (including ship-from-store and ship-to-store models) by
customers is also positively impacting volume growth for both our residential and commercial ground products.
Rates and Product Mix
2014 compared to 2013
Overall revenue per piece decreased 1.5% in 2014, and was impacted by changes in base rates, customer and product
mix, and fuel surcharge rates.
Revenue per piece for our ground and air products was positively impacted by an increase in base rates that took effect on
December 30, 2013. We implemented an average 4.9% net increase in base and accessorial rates on UPS Next Day Air, UPS
2nd Day Air and UPS 3 Day Select and UPS Ground.
Revenue per piece increased for our Next Day Air products in 2014, largely due to the base rate increase, an increase in
the average weight per package, and a shift in product mix from lower-yielding letters towards higher-yielding packages.
Revenue per piece declined for our deferred products in 2014, as customer and product mix changes more than offset the
increase in base rates. Product mix adversely impacted deferred revenue per piece, as we experienced relatively stronger
growth in our lighter-weight business-to-consumer shipments, which have lower average yields than our heavier-weight
commercial shipments. Customer mix also adversely impacted deferred revenue per piece, due to the faster volume growth
among our larger customers, which typically have a lower average yield than our smaller and middle-market customers.
Ground revenue per piece decreased in 2014, as customer and product mix changes more than offset the impact of the
base rate increase. Customer and product mix changes adversely impacted revenue per piece as a greater portion of our overall
volume in 2014, relative to 2013, came from lighter-weight shipments (including more than 45% volume growth in SurePost)
and larger customers.
2013 compared to 2012
Overall revenue per piece was relatively flat in 2013 compared with 2012, and was impacted by changes in base rates,
customer and product mix, and fuel surcharge rates.
Revenue per piece for our ground and air products was positively impacted by an increase in base rates that took effect on
December 31, 2012. We increased the base rates 6.5% on UPS Next Day Air, UPS 2nd Day Air and UPS 3 Day Select, and
5.9% on UPS Ground, while reducing our fuel surcharge indices. Other pricing changes included an increase in the residential
surcharge, and an increase in the delivery area surcharge on certain residential and commercial services. These rate changes are
customary and occur on an annual basis.
Revenue per piece increased for Next Day Air in 2013, and was positively impacted by the base rate increase and the loss
of some lower-yielding letter volume. Revenue per piece for our deferred products declined, as the impact of the base rate
increase was more than offset by declines in fuel surcharge rates and changes in customer and product mix. Revenue per piece
for our air products was adversely impacted by the relatively stronger growth in our lower-yielding Next Day Air Saver and
deferred products, compared with our premium Next Day Air services, as well as the faster growth in lighter-weight business-
to-consumer shipments. Additionally, revenue per piece was negatively affected by the faster volume growth among our larger
customers, which typically have a lower average yield than our smaller and middle-market customers.