Vodafone 2011 Annual Report Download - page 10
Download and view the complete annual report
Please find page 10 of the 2011 Vodafone annual report below. You can navigate through the pages in the report by either clicking on the pages listed below, or by using the keyword search tool below to find specific information within the annual report.-
 1
1 -
 2
2 -
 3
3 -
 4
4 -
 5
5 -
 6
6 -
 7
7 -
 8
8 -
 9
9 -
 10
10 -
 11
11 -
 12
12 -
 13
13 -
 14
14 -
 15
15 -
 16
16 -
 17
17 -
 18
18 -
 19
19 -
 20
20 -
 21
21 -
22
-
23
-
24
-
25
-
26
-
27
-
28
-
29
-
30
-
31
-
32
-
33
-
34
-
35
-
36
-
37
-
38
-
39
-
40
-
41
-
42
-
43
-
44
-
45
-
46
-
47
-
48
-
49
-
50
-
51
-
52
-
53
-
54
-
55
-
56
-
57
-
58
-
59
-
60
-
61
-
62
-
63
-
64
-
65
-
66
-
67
-
68
-
69
-
70
-
71
-
72
-
73
-
74
-
75
-
76
-
77
-
78
-
79
-
80
-
81
-
82
-
83
-
84
-
85
-
86
-
87
-
88
-
89
-
90
-
91
-
92
-
93
-
94
-
95
-
96
-
97
-
98
-
99
-
100
-
101
-
102
-
103
-
104
-
105
-
106
-
107
-
108
-
109
-
110
-
111
-
112
-
113
-
114
-
115
-
116
-
117
-
118
-
119
-
120
-
121
-
122
-
123
-
124
-
125
-
126
-
127
-
128
-
129
-
130
-
131
-
132
-
133
-
134
-
135
-
136
-
137
-
138
-
139
-
140
-
141
-
142
-
143
-
144
-
145
-
146
-
147
-
148
-
149
-
150
-
151
-
152
-
153
-
154
-
155
-
156
 |
 |

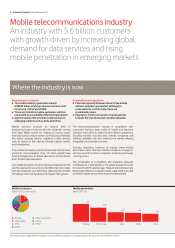
Where the industry is now
Mobile telecommunications industry
An industry with 5.6 billion customers
with growth driven by increasing global
demand for data services and rising
mobile penetration in emerging markets
Mobile penetration
March 2011 (%)
Mobile customers
March 2011: 5.6 billion (%)
Europe US/Canada India China Africa
Revenue and customers
■The mobile industry generates around
US$900 billion of annual revenue and accounts
for around 1.5% of world GDP.
■There are 5.6 billion mobile customers which is
equivalent to around 80% of the world population.
■Approximately 75% of mobile customers are in
emerging markets such as India and China.
Mobile services account for around 60% of
telecommunications revenue with the remainder coming
from xed. Within mobile the majority of income comes
from voice calls in mature markets such as Europe. However,
the fastest growing revenue segment is data services
such as access to the internet through laptops, tablets
and smartphones.
The number of mobile customers far exceeds other forms of
electronic communication. Only 1.3 billion people have
xed line telephones, 2.1 billion have access to the internet
and 1.2 billion have televisions.
The mobile proportion of voice calls has increased over the
last ve years and now accounts for 82% of all calls made,
with the remainder over xed lines, reecting the benets
of mobility, lower cost handsets and cheaper calling plans.
Competition and regulation
■There are typically between three to five mobile
network operators per market, although in
some markets, such as India, there are
considerably more.
■Regulators continue to seek to impose policies
to lower the cost of access to mobile networks.
The telecommunications industry is competitive with
consumers having a large choice of mobile and xed line
operators from which to select services. Newer competitors,
including handset manufacturers, internet companies and
software providers, are also entering the market offering
integrated communication services.
Industry regulators continue to impose lower mobile
termination rates (the fees mobile companies charge for
calls received from other companies’ networks) and lower
roaming prices.
The combination of competition and regulatory pressures
contributed to a 10% decline in the global average price per
minute in the 2010 calendar year. However, price pressures are
being partly offset by increased mobile usage leading to a 6%
increase in mobile service revenue over the same period.
Europe
US/Canada
India
China
Other Asia Pacific
Africa
Other
130
103
The industry data on pages 8 and 9 has been sourced from Wireless Intelligence, Strategy Analytics, Merrill Lynch, Informa WCIS and CISCO.
58
65
69
19
6
16
10
15
16
18
8 Vodafone Group Plc Annual Report 2011