eBay 1999 Annual Report Download - page 75
Download and view the complete annual report
Please find page 75 of the 1999 eBay annual report below. You can navigate through the pages in the report by either clicking on the pages listed below, or by using the keyword search tool below to find specific information within the annual report.-
 1
1 -
2
-
3
-
4
-
5
-
6
-
7
-
8
-
9
-
10
-
11
-
12
-
13
-
14
-
15
-
16
-
17
-
18
-
19
-
20
-
21
-
22
-
23
-
24
-
25
-
26
-
27
-
28
-
29
-
30
-
31
-
32
-
33
-
34
-
35
-
36
-
37
-
38
-
39
-
40
-
41
-
42
-
43
-
44
-
45
-
46
-
47
-
48
-
49
-
50
-
51
-
52
-
53
-
54
-
55
-
56
-
57
-
58
-
59
-
60
-
61
-
62
-
63
-
64
-
 65
65 -
 66
66 -
 67
67 -
 68
68 -
 69
69 -
 70
70 -
 71
71 -
 72
72 -
 73
73 -
 74
74 -
 75
75 -
 76
76 -
 77
77 -
 78
78 -
 79
79 -
 80
80 -
 81
81
 |
 |

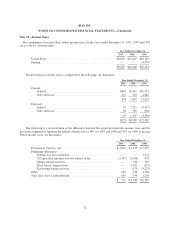
The following table summarizes information about fixed stock options outstanding at December 31, 1999,
(shares in thousands):
Options Outstanding at
December 31, 1999
Options Exercisable at
December 31, 1999
Range of
Exercise Prices
Number of
Shares
Outstanding
Weighted Average
Remaining
Contractual Life
Weighted
Average
Exercise
Price
Number of
Shares
Exercisable
Weighted
Average
Exercise
Price
$0.01–$3.11 ........ 2,351 8.2 years $ 1.15 792 $ 0.87
4.67–4.67 ......... 1,253 8.5 4.67 124 4.67
5.00–5.00 ......... 3,768 8.6 5.00 821 5.00
16.85–127.06 ...... 2,269 9.5 98.97 18 75.56
127.88–152.06 ...... 2,476 9.7 141.88 12 138.50
154.13–209.00 ...... 1,001 9.5 176.37 60 166.50
13,118 8.9 59.45 1,827 10.06
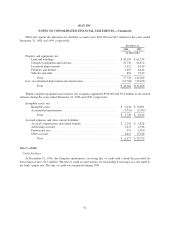
Fair value disclosures
The Company calculated the fair value of each option grant on the date of grant using the Black-Scholes
option pricing model as prescribed by SFAS No. 123 using the following assumptions:
Year Ended
December 31,
1997 1998 1999
Risk-free interest rates ............................................ 5.9% 4.9% 5.5%
Expected lives (in years) .......................................... 5.0 3.0 3.0
Dividend yield ................................................. 0% 0% 0%
Expected volatility .............................................. 0% 80%100%
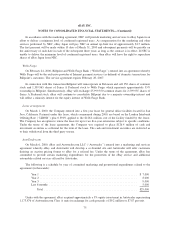
Prior to the Company’s initial public offering, the fair value of each option grant was determined using the
minimum value method. Subsequent to the offering, the fair value was determined using the Black-Scholes
model. The compensation cost associated with the Company’s stock-based compensation plans, determined using
the minimum value method prescribed by SFAS No. 123, did not result in a material difference from the reported
net income for the year ended December 31, 1997. The effect of compensation cost on net income and earnings
per share for the years ended December 31, 1998 and 1999 are as follows, (in thousands, except per share
amounts):
1998 1999
Net income:
As reported . ...................................................... $7,273 $ 10,828
Pro forma . ....................................................... $6,497 $(60,190)
Net income/(loss) per share—basic:
As reported . ...................................................... $ 0.14 $ 0.10
Pro forma . ....................................................... $ 0.12 $ (0.56)
Net income/(loss) per share—diluted:
As reported . ...................................................... $ 0.06 $ 0.08
Pro forma . ....................................................... $ 0.06 $ (0.56)
eBAY INC.
NOTES TO CONSOLIDATED FINANCIAL STATEMENTS—(Continued)
70