eBay 2010 Annual Report Download - page 72
Download and view the complete annual report
Please find page 72 of the 2010 eBay annual report below. You can navigate through the pages in the report by either clicking on the pages listed below, or by using the keyword search tool below to find specific information within the annual report.-
 1
1 -
2
-
3
-
4
-
5
-
6
-
7
-
8
-
9
-
10
-
11
-
12
-
13
-
14
-
15
-
16
-
17
-
18
-
19
-
20
-
21
-
22
-
23
-
24
-
25
-
26
-
27
-
28
-
29
-
30
-
31
-
32
-
33
-
34
-
35
-
36
-
37
-
38
-
39
-
40
-
41
-
42
-
43
-
44
-
45
-
46
-
47
-
48
-
49
-
50
-
51
-
52
-
53
-
54
-
55
-
56
-
57
-
58
-
59
-
60
-
61
-
 62
62 -
 63
63 -
 64
64 -
 65
65 -
 66
66 -
 67
67 -
 68
68 -
 69
69 -
 70
70 -
 71
71 -
 72
72 -
 73
73 -
 74
74 -
 75
75 -
 76
76 -
 77
77 -
 78
78 -
 79
79 -
 80
80 -
 81
81 -
 82
82 -
83
-
84
-
85
-
86
-
87
-
88
-
89
-
90
-
91
-
92
-
93
-
94
-
95
-
96
-
97
-
98
-
99
-
100
-
101
-
102
-
103
-
104
-
105
-
106
-
107
-
108
-
109
-
110
-
111
-
112
-
113
-
114
-
115
-
116
-
117
-
118
-
119
-
120
-
121
-
122
-
123
-
124
-
125
-
126
-
127
-
128
-
129
-
130
-
131
-
132
-
133
-
134
-
135
-
136
-
137
-
138
-
139
-
140
 |
 |

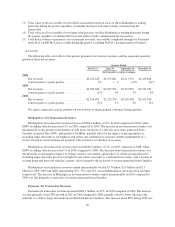
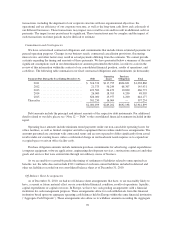
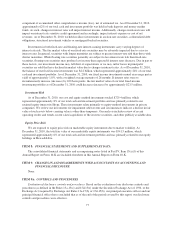
Liquidity and Capital Resources
Cash Flows
Year Ended December 31,
2008 2009 2010
(In thousands)
Consolidated Cash Flow Data:
Net cash provided by (used in):
Operating activities .................................... $2,881,995 $ 2,908,086 $ 2,745,760
Investing activities .................................... (2,057,346) (1,149,383) (2,282,470)
Financing activities .................................... (1,673,851) (945,656) 1,234,406
Effect of exchange rates on cash and cash equivalents ......... (183,061) (2,157) (120,103)
Net increase (decrease) in cash and cash equivalents .......... $(1,032,263) $ 810,890 $ 1,577,593
Operating Activities
We generated cash from operating activities in amounts greater than net income in 2008, 2009 and 2010,
due primarily to non-cash charges to earnings. Non-cash charges to earnings included depreciation and
amortization on our long-term assets, stock-based compensation and the provision for transaction and loan losses.
Non-cash items in 2009 also included a $1.4 billion gain on the sale of Skype. The decrease in cash provided by
operating activities in 2010 compared to 2009 was due primarily to an increase in cash paid for taxes of $303.6
million related primarily to a legal entity restructuring completed in the fourth quarter 2009 and tax settlement in
the fourth quarter of 2010.
Cash paid for income taxes in 2008, 2009 and 2010 was $366.8 million, $342.2 million and $645.8 million,
respectively.
Investing Activities
The net cash used in investing activities of $2.3 billion in 2010 was due primarily to cash paid for purchases
of investments of $2.6 billion, purchases of property and equipment, net, of $723.9 million and the purchase of
consumer loan receivables (net of collections) originated through our Bill Me Later merchant network of $379.7
million, partially offset by proceeds of $1.4 billion from maturities and sales of investments.
The net cash used in investing activities in 2009 was due primarily to cash paid for acquisitions, investments
and property and equipment, partially offset by proceeds from the sale of Skype. In 2009, we acquired Gmarket.
The net cash used in investing activities in 2008, was due primarily to cash paid for acquisitions and property and
equipment. In 2008, we acquired Fraud Sciences, Den Blå Avis and BilBasen and Bill Me Later.
Financing Activities
The net cash provided by financing activities of $1.2 billion in 2010 was due primarily to cash proceeds
from our sale of $1.5 billion of senior unsecured debt securities in October 2010 and $300.0 million of net
borrowings under a commercial paper program that we implemented in November 2010, $235.5 million in
proceeds from the issuance of common stock upon the exercise of stock options, and $41.9 million of excess tax
benefits from stock-based compensation. These proceeds were partially offset by cash outflows of $711.1 million
to repurchase approximately 26.8 million shares of our common stock, as well as $120.6 million paid for tax
withholdings related to the net share settlements of restricted stock awards and units.
The net cash used in financing activities of $945.7 million in 2009 was due primarily to net repayments
under our credit agreement of $1.0 billion. The net cash used in financing activities of $1.7 billion in 2008 was
67