eBay 2011 Annual Report Download - page 112
Download and view the complete annual report
Please find page 112 of the 2011 eBay annual report below. You can navigate through the pages in the report by either clicking on the pages listed below, or by using the keyword search tool below to find specific information within the annual report.-
 1
1 -
2
-
3
-
4
-
5
-
6
-
7
-
8
-
9
-
10
-
11
-
12
-
13
-
14
-
15
-
16
-
17
-
18
-
19
-
20
-
21
-
22
-
23
-
24
-
25
-
26
-
27
-
28
-
29
-
30
-
31
-
32
-
33
-
34
-
35
-
36
-
37
-
38
-
39
-
40
-
41
-
42
-
43
-
44
-
45
-
46
-
47
-
48
-
49
-
50
-
51
-
52
-
53
-
54
-
55
-
56
-
57
-
58
-
59
-
60
-
61
-
62
-
63
-
64
-
65
-
66
-
67
-
68
-
69
-
70
-
71
-
72
-
73
-
74
-
75
-
76
-
77
-
78
-
79
-
80
-
81
-
82
-
83
-
84
-
85
-
86
-
87
-
88
-
89
-
90
-
91
-
92
-
93
-
94
-
95
-
96
-
97
-
98
-
99
-
100
-
101
-
 102
102 -
 103
103 -
 104
104 -
 105
105 -
 106
106 -
 107
107 -
 108
108 -
 109
109 -
 110
110 -
 111
111 -
 112
112 -
 113
113 -
 114
114 -
 115
115 -
 116
116 -
 117
117 -
 118
118 -
 119
119 -
 120
120 -
 121
121 -
 122
122 -
123
-
124
-
125
-
126
-
127
-
128
-
129
-
130
-
131
-
132
-
133
-
134
-
135
-
136
-
137
-
138
-
139
-
140
-
141
-
142
-
143
-
144
-
145
-
146
-
147
-
148
-
149
-
150
-
151
-
152
-
153
-
154
-
155
-
156
-
157
-
158
-
159
 |
 |

eBay Inc.
NOTES TO CONSOLIDATED FINANCIAL STATEMENTS—(Continued)
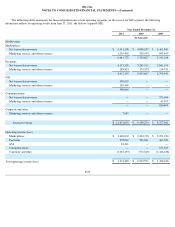
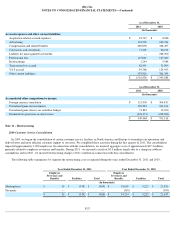
The following tables summarize the allocation of net revenues and long-lived tangible assets based on geography (in thousands):
Net revenues are attributed to U.S. and international geographies primarily based upon the country in which the seller, payment recipient,
customer, Skype user's Internet protocol address (through November 19, 2009), website that displays advertising, or other service provider, as the
case may be, is located. Long-lived assets attributed to the U.S. and international geographies are based upon the country in which the asset is
located or owned.
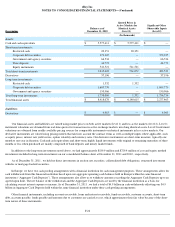
Note 7 - Investments
At December 31, 2011 and 2010 , the estimated fair value of our short-term and long-term investments classified as available for sale, are as
follows:
F-21
Year Ended December 31,
2011
2010
2009
U.S.
$
5,483,641
$
4,214,215
$
3,985,068
Germany
1,538,738
1,204,056
1,140,205
United Kingdom
1,572,192
1,266,603
1,054,730
Rest of world
3,057,083
2,471,400
2,547,359
Total net revenues
$
11,651,654
$
9,156,274
$
8,727,362
December 31,
2011
2010
U.S.
$
2,202,626
$
1,465,234
International
128,151
186,251
Total long-lived tangible assets
$
2,330,777
$
1,651,485
December 31, 2011
Gross
Amortized
Cost
Gross
Unrealized
Gains
Gross
Unrealized
Losses
Estimated
Fair Value
(In thousands)
Short-term investments:
Restricted cash
$
19,490
$
—
$
—
$
19,490
Corporate debt securities
447,804
1,075
(384
)
448,495
Government and agency securities
42,071
17
(2
)
42,086
Time deposits and other
81,883
—
—
81,883
Equity instruments
8,507
637,840
—
646,347
$
599,755
$
638,932
$
(386
)
$
1,238,301
Long-term investments:
Restricted cash
$
1,342
$
—
$
—
$
1,342
Corporate debt securities
2,237,395
6,335
(58,026
)
2,185,704
Government and agency securities
70,015
1,131
(1
)
71,145
$
2,308,752
$
7,466
$
(58,027
)
$
2,258,191