Adobe 2009 Annual Report Download - page 120
Download and view the complete annual report
Please find page 120 of the 2009 Adobe annual report below. You can navigate through the pages in the report by either clicking on the pages listed below, or by using the keyword search tool below to find specific information within the annual report.-
 1
1 -
2
-
3
-
4
-
5
-
6
-
7
-
8
-
9
-
10
-
11
-
12
-
13
-
14
-
15
-
16
-
17
-
18
-
19
-
20
-
21
-
22
-
23
-
24
-
25
-
26
-
27
-
28
-
29
-
30
-
31
-
32
-
33
-
34
-
35
-
36
-
37
-
38
-
39
-
40
-
41
-
42
-
43
-
44
-
45
-
46
-
47
-
48
-
49
-
50
-
51
-
52
-
53
-
54
-
55
-
56
-
57
-
58
-
59
-
60
-
61
-
62
-
63
-
64
-
65
-
66
-
67
-
68
-
69
-
70
-
71
-
72
-
73
-
74
-
75
-
76
-
77
-
78
-
79
-
80
-
81
-
82
-
83
-
84
-
85
-
86
-
87
-
88
-
89
-
90
-
91
-
92
-
93
-
94
-
95
-
96
-
97
-
98
-
99
-
100
-
101
-
102
-
103
-
104
-
105
-
106
-
107
-
108
-
109
-
 110
110 -
 111
111 -
 112
112 -
 113
113 -
 114
114 -
 115
115 -
 116
116 -
 117
117 -
 118
118 -
 119
119 -
 120
120 -
 121
121 -
 122
122 -
 123
123 -
 124
124 -
 125
125 -
 126
126 -
 127
127 -
 128
128 -
 129
129 -
 130
130 -
131
-
132
-
133
-
134
-
135
-
136
-
137
-
138
-
139
 |
 |

ADOBE SYSTEMS INCORPORATED
NOTES TO CONSOLIDATED FINANCIAL STATEMENTS (Continued)
120
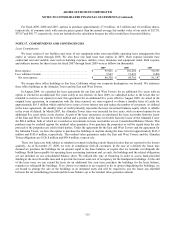
The tables below list our revenue and property and equipment, net, by geographic area for fiscal 2009, 2008 and 2007
(in thousands). With the exception of property and equipment, we do not identify or allocate our assets by geographic area.
Revenue
2009
2008
2007
Americas:
United States .....................................
$
1,244,631
$
1,473,319
$
1,379,028
Other............................................
137,940
159,507
129,776
Total Americas .................................
1,382,571
1,632,826
1,508,804
EMEA ............................................
928,857
1,229,161
1,026,455
Asia:
Japan .........................................
410,055
450,799
407,344
Other............................................
224,370
267,103
215,278
Total Asia .....................................
634,425
717,902
622,622
Revenue ...........................................
$
2,945,853
$
3,579,889
$
3,157,881
Property and Equipment
2009
2008
Americas:
United States ......................................................
$
336,303
$
252,434
Other.............................................................
5,806
9,154
Total Americas ..................................................
342,109
261,588
EMEA .............................................................
23,729
29,887
Asia:
India .............................................................
14,625
15,242
Other.............................................................
7,669
6,320
Total Asia ......................................................
22,294
21,562
Property and equipment, net ............................................
$
388,132
$
313,037
Significant Customers
As listed, our significant customers are distributors who sell products across our various segments. Our significant
customers, as a percentage of net revenue for fiscal 2009, 2008 and 2007 were as follows:
2009
2008
2007
Ingram Micro ..........................................
15
%
18
%
21
%
Tech Data .............................................
8
%
9
%
10
%
Receivables from our significant customers, as a percentage of gross trade receivables for fiscal 2009 and 2008 were as
follows:
2009
2008
Ingram Micro ............................................................
16
%
18
%
Tech Data ...............................................................
6
%
8
%