Ameriprise 2009 Annual Report Download - page 84
Download and view the complete annual report
Please find page 84 of the 2009 Ameriprise annual report below. You can navigate through the pages in the report by either clicking on the pages listed below, or by using the keyword search tool below to find specific information within the annual report.-
 1
1 -
2
-
3
-
4
-
5
-
6
-
7
-
8
-
9
-
10
-
11
-
12
-
13
-
14
-
15
-
16
-
17
-
18
-
19
-
20
-
21
-
22
-
23
-
24
-
25
-
26
-
27
-
28
-
29
-
30
-
31
-
32
-
33
-
34
-
35
-
36
-
37
-
38
-
39
-
40
-
41
-
42
-
43
-
44
-
45
-
46
-
47
-
48
-
49
-
50
-
51
-
52
-
53
-
54
-
55
-
56
-
57
-
58
-
59
-
60
-
61
-
62
-
63
-
64
-
65
-
66
-
67
-
68
-
69
-
70
-
71
-
72
-
73
-
 74
74 -
 75
75 -
 76
76 -
 77
77 -
 78
78 -
 79
79 -
 80
80 -
 81
81 -
 82
82 -
 83
83 -
 84
84 -
 85
85 -
 86
86 -
 87
87 -
 88
88 -
 89
89 -
 90
90 -
 91
91 -
 92
92 -
 93
93 -
 94
94 -
95
-
96
-
97
-
98
-
99
-
100
-
101
-
102
-
103
-
104
-
105
-
106
-
107
-
108
-
109
-
110
-
111
-
112
-
113
-
114
-
115
-
116
-
117
-
118
-
119
-
120
-
121
-
122
-
123
-
124
-
125
-
126
-
127
-
128
-
129
-
130
-
131
-
132
-
133
-
134
-
135
-
136
-
137
-
138
-
139
-
140
-
141
-
142
-
143
-
144
-
145
-
146
-
147
-
148
-
149
-
150
-
151
-
152
-
153
-
154
-
155
-
156
-
157
-
158
-
159
-
160
-
161
-
162
-
163
-
164
-
165
-
166
-
167
-
168
-
169
-
170
-
171
-
172
-
173
-
174
-
175
-
176
-
177
-
178
-
179
-
180
-
181
-
182
-
183
-
184
-
185
-
186
-
187
-
188
-
189
-
190
 |
 |

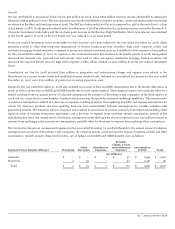
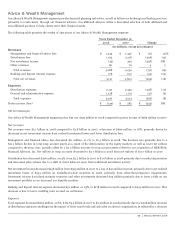
in net revenues per advisor from $315,000 in 2007 to $267,000 in 2008. General and administrative expense decreased $37 million, or
3%, from the prior year primarily due to our expense reduction initiatives in 2008, partially offset by acquisition integration costs.
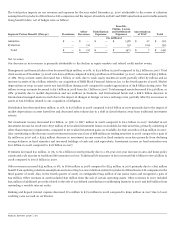
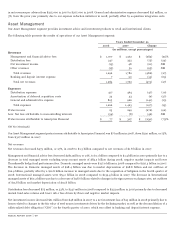
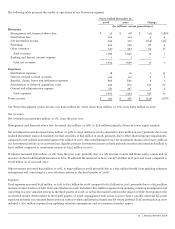
Asset Management
Our Asset Management segment provides investment advice and investment products to retail and institutional clients.
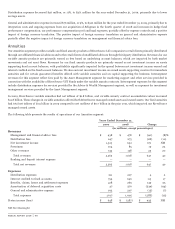
The following table presents the results of operations of our Asset Management segment:
Years Ended December 31,
2008 2007 Change
(in millions, except percentages)
Revenues
Management and financial advice fees $ 1,077 $ 1,362 $ (285) (21)%
Distribution fees 247 322 (75) (23)
Net investment income (13) 48 (61) NM
Other revenues (15) 50 (65) NM
Total revenues 1,296 1,782 (486) (27)
Banking and deposit interest expense 7 20 (13) (65)
Total net revenues 1,289 1,762 (473) (27)
Expenses
Distribution expenses 417 464 (47) (10)
Amortization of deferred acquisition costs 24 33 (9) (27)
General and administrative expense 825 966 (141) (15)
Total expenses 1,266 1,463 (197) (13)
Pretax income 23 299 (276) (92)
Less: Net loss attributable to noncontrolling interests (54) (8) (46) NM
Pretax income attributable to Ameriprise Financial $ 77 $ 307 $ (230) (75)%
NM Not Meaningful.
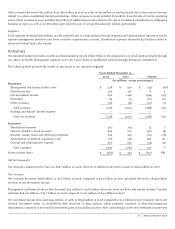
Our Asset Management segment pretax income attributable to Ameriprise Financial was $77 million in 2008, down $230 million, or 75%,
from $307 million in 2007.
Net revenues
Net revenues decreased $473 million, or 27%, in 2008 to $1.3 billion compared to net revenues of $1.8 billion in 2007.
Management and financial advice fees decreased $285 million, or 21%, to $1.1 billion compared to $1.4 billion in 2007 primarily due to a
decrease in total managed assets excluding wrap account assets of $83.2 billion during 2008, negative market impacts and lower
Threadneedle hedge fund performance fees. Domestic managed assets were $127.9 billion in 2008 compared to $156.3 billion in 2007.
The decrease in Domestic managed assets of $28.4 billion was due to market depreciation of $28.8 billion and net outflows of
$12.9 billion, partially offset by a $12.8 billion increase in managed assets due to the acquisition of Seligman in the fourth quarter of
2008. International managed assets were $74.2 billion in 2008 compared to $134.4 billion in 2007. The decrease in International
managed assets of $60.2 billion was due to a decrease of $28.6 billion related to changes in foreign currency exchange rates, net outflows
of $15.8 billion and market depreciation of $19.8 billion.
Distribution fees decreased $75 million, or 23%, to $247 million in 2008 compared to $322 million in 2007 primarily due to decreased
mutual fund sales volume and lower 12b-1 fees driven by flows and negative market impacts.
Net investment income decreased $61 million from $48 million in 2007 to a net investment loss of $13 million in 2008 primarily due to
losses related to changes in the fair value of seed money investments driven by the declining market, as well as the deconsolidation of a
collateralized debt obligation (‘‘CDO’’) in the fourth quarter of 2007, which was offset in banking and deposit interest expense.
ANNUAL REPORT 2009 69